 |
||
|
|
||
| |||||||||||||||
|
|
 ERDC TN-DOER-C15
July 2000
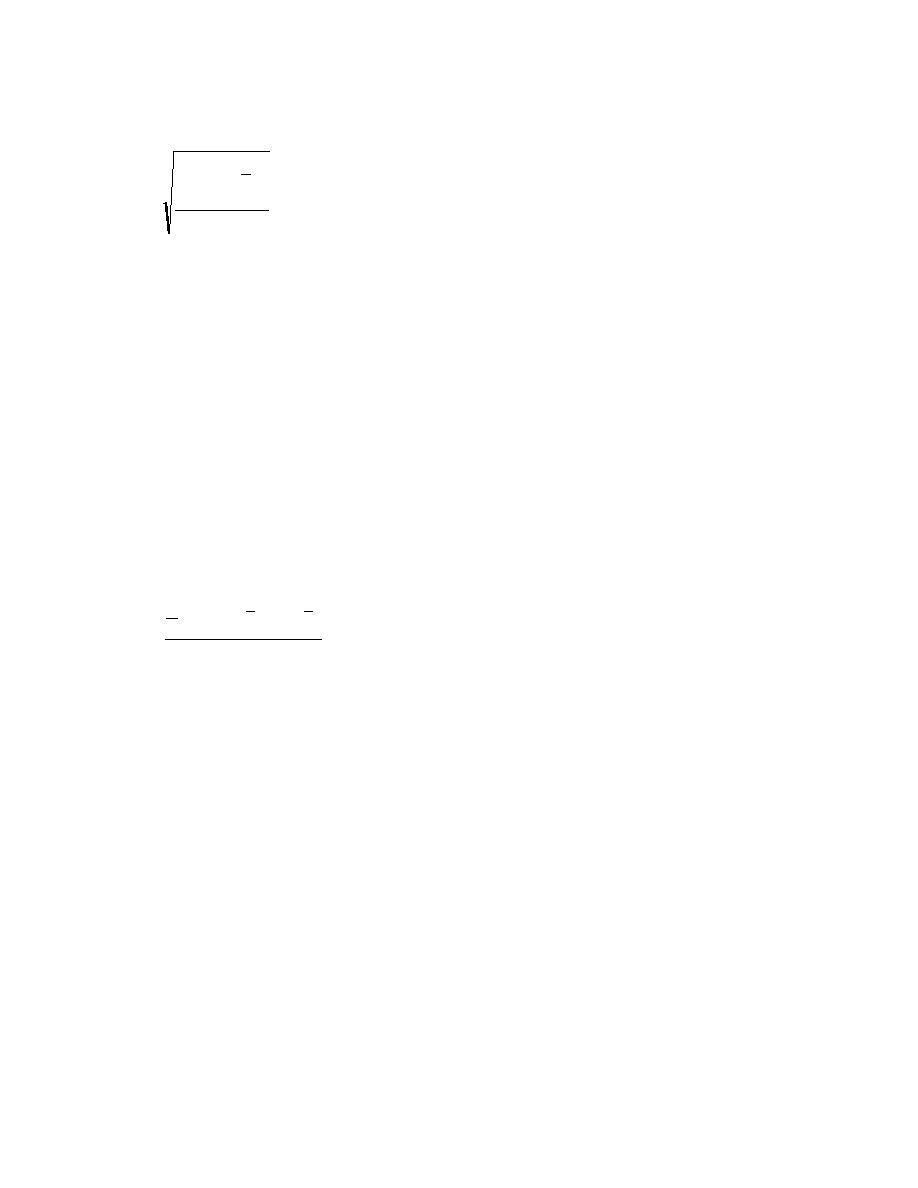
The standard deviation s has the same units as the mean and is defined as follows:
b xi - x g2
n
∑
i =1
s=
(I3)
n-1
(The square of the standard deviation s2 is known as the variance. The term is less commonly used
because the units are squared and it is not, therefore, as intuitively useful; but it refers to the same
characteristic of the data. A high variance indicates widely variable data; a low variance indicates
little variability.)
Range The range is also a measure of the scatter of the data, is useful for bracketing the extremes
of the data, and can also be used for a rough estimate of the standard deviation (s ≈ R/4). The range
is simply the difference between the largest and the smallest value in the data set. The range can
be influenced by the existence of a single extreme value. The 10-90 percent range is less sensitive
to the presence of a few extreme data points, and is the difference between the highest and lowest
values of 80 percent of the data. The interquartile range is a similar statistic, excluding the upper
and lower 25 percent of the data.
Correlation coefficient a measure of the linearity of the relationship between two parameters.
The correlation coefficient is given as:
b
gb
g
1
∑ xi - x yi - y
ρ= n
(I4)
σ xσ y
where σi is the standard deviation of the population, estimated for a sample as s, as previously
defined.
Covariance The covariance is defined by the numerator of the correlation coefficient, and is
sometimes used alone as a summary statistic. Dividing the covariance by the standard deviations
ensures that the correlation coefficient is always between 1, and is therefore independent of the
magnitude of the data (Isaaks and Srivastava 1989).
Bias "An estimator of a parameter is said to be unbiased if the mean of its distribution is equal to
the true value of the parameter. Otherwise, the estimator is said to be biased" (Mendenhall and
Beaver 1994).
Accuracy and precision These are two terms of importance that are frequently confused.
Accuracy refers to the closeness of a measured value to the true value. Measured values may differ
from the true value as a result of instrument variability, operator error, losses in handling, and sample
contamination from other sources. Precision refers to the repeatability of a method. Data that are
accurate and precise are desirable, but accuracy cannot be determined for an unknown quantity
(such as the concentration of lead in a soil sample). Data that are precise at least assure that methods
18
|
|
Privacy Statement - Press Release - Copyright Information. - Contact Us - Support Integrated Publishing |