 |
||
|
|
||
|
Page Title:
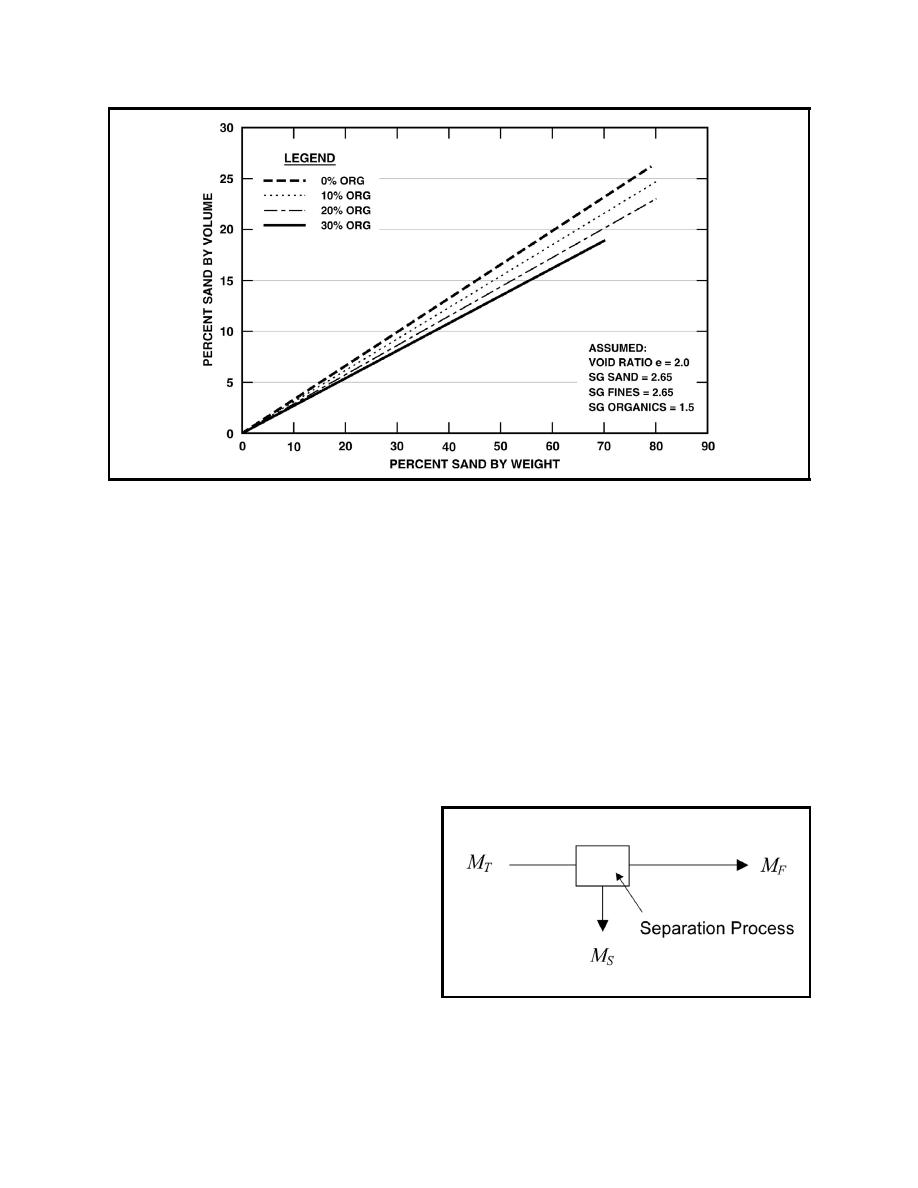
Figure 5. Percent sand by volume versus percent sand by weight, for void ratio 2.0 and organic specific gravity of 1.5 |
||
| |||||||||||||||
|
|
 ERDC TN-DOER-C27
July 2002
Figure 5. Percent sand by volume versus percent sand by weight, for void ratio 2.0 and organic specific
gravity of 1.5
the entire deposit, coupled with proportional bulk sediment volumes, the best- and worst-case
volume reduction potential for the total project volume can be roughly estimated.
In the recovery of a specified fraction from the bulk material, the material is slurried and separated
around a "cut size" using equipment best suited to make the specified separation. Where a
coarse/fine separation is desired, the cut is typically made at about 75 m. The material does not
separate sharply at this cut size, however. A percentage of the material below the cut size will report
with the coarse material. Similarly, a percentage of the material above the cut size will report with
the fines. These proportions will vary depending upon the type and efficiency of the selected
process. The major products will typically include a coarse fraction, a fine fraction, and a wastewater
stream. These concepts are illustrated in Figures 6 and 7.
Solids Mass Balance - Although the sedi-
ment or dredged material will be slurried with
water in the course of dredging and process-
ing, conceptually it is helpful to look at the
solid and water balances separately. Figure 6
is a simplification of the actual distribution
of solids.
MT is the solids mass flow rate (M/T) from a
dredge or CDF excavation process, and is Figure 6. Solids mass balance diagram
represented by the following equation:
9
|
|
Privacy Statement - Press Release - Copyright Information. - Contact Us - Support Integrated Publishing |
