 |
||
|
|
||
|
Page Title:
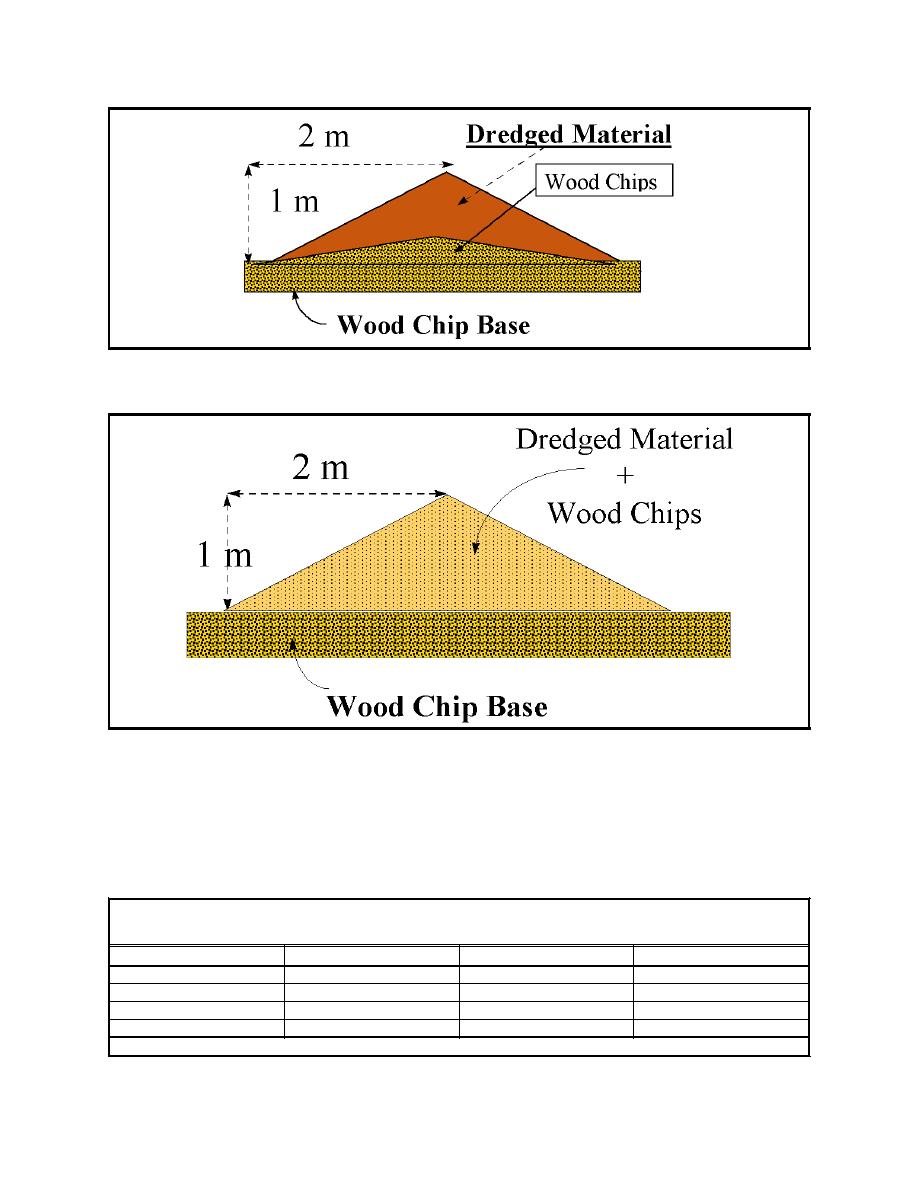
Figure 3. Schematic of windrow cross section before mixing |
||
| |||||||||||||||
|
|
 Technical Note DOER-C5
September 1999
Figure 3. Schematic of windrow cross section before mixing
Figure 4. Schematic of windrow cross section after mixing
Measurements of oxygen and carbon dioxide concentration, temperature, pH, and moisture content
are collected each week before turning. Concentrations of PAHs, nitrogen, phosphorus, and other
parameters are collected at the end of each month. On the basis of these results, water and/or nutrient
additions are made. Target ranges for selected parameters are listed in Table 2.
Table 2
Monitoring Parameters for Biomounds at the Milwaukee CDF
Parameter
Minimum
Maximum
Monitoring Frequency
Oxygen
2%
Weekly
Moisture
40%
80%
Weekly
C:N:P*
100:1:0.5
100:10:1
Monthly
pH
6.0
8.0
Weekly
* C:N:P = carbon:nitrogen:phosphorus ratio.
7
|
|
Privacy Statement - Press Release - Copyright Information. - Contact Us - Support Integrated Publishing |
