 |
||
|
|
||
|
Page Title:
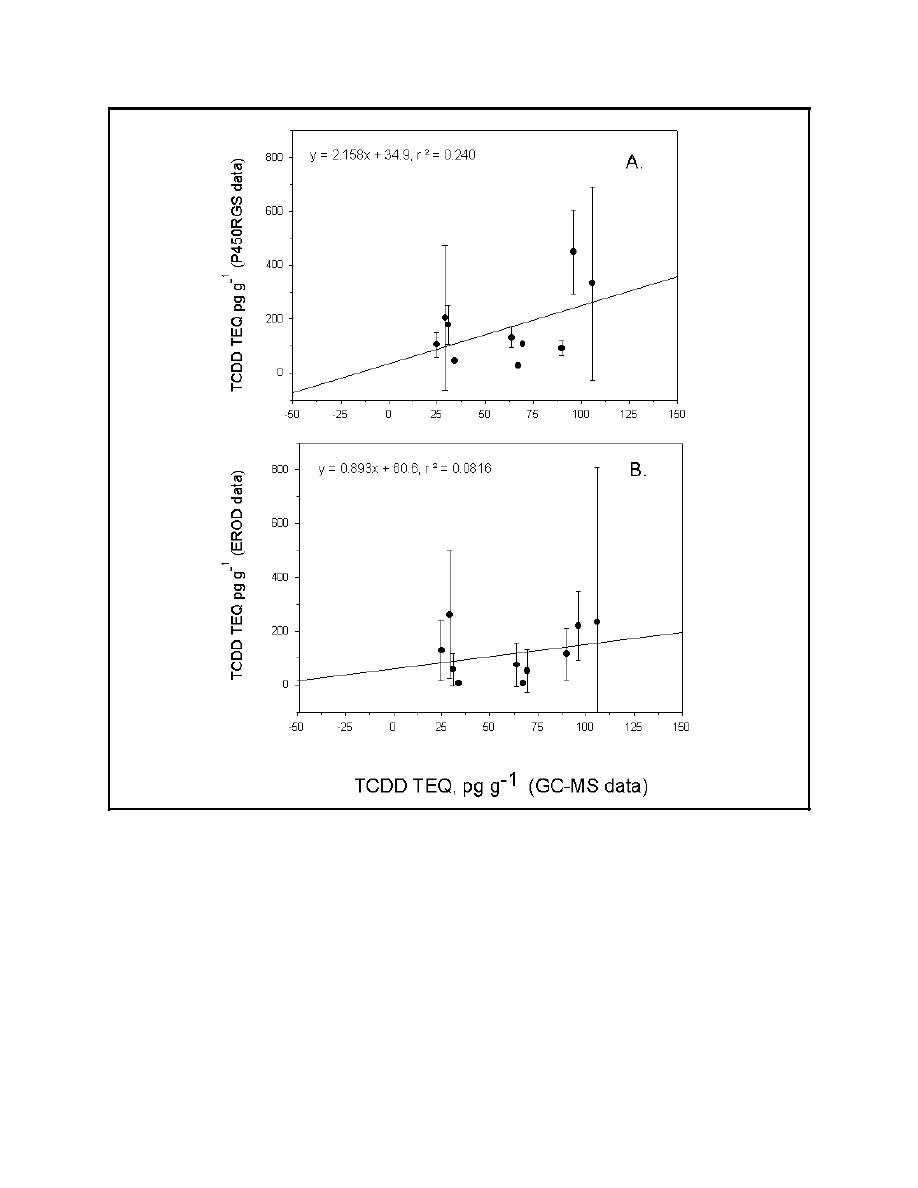
Figure 1. Correlation of calculated TCDD TEQs for GC/MS data with measured TCDD TEQs using the P450RGS assay |
||
| |||||||||||||||
|
|
 Technical Note DOER-C8
July 1999
Figure 1. Correlation of calculated TCDD TEQs for GC/MS data with measured TCDD TEQs using the
P450RGS assay (A) or the EROD assay (B) on 10 SA/SG-cleaned NYDMMP sediment
extracts (Means of six replicates SD)
For comparisons of the GC/MS results with cell-based assay results on the crude NYDMMP
sediment extracts, the GC/MS TEQs were calculated using PCDD/PCDF, PCB, and PAH data.
TEQs of both assays appeared to correlate well with the TEQs calculated from the analytical
chemistry data (r2 = 0.742 and 0.805 for P450RGS and EROD assays, respectively). However, it
is obvious that the correlations were strongly influenced by the most contaminated sediment and
the clustering of the nine lesser contaminated sediments (Figures 3A, 3B). The same effect is evident
in the correlation of TEQs between the two assays (Figure 4). If the influence point is omitted, the
correlation is lost for all three comparisons with r2s ranging only from 0.0012 for the comparison
4
|
|
Privacy Statement - Press Release - Copyright Information. - Contact Us - Support Integrated Publishing |
