 |
||
|
|
||
|
Page Title:
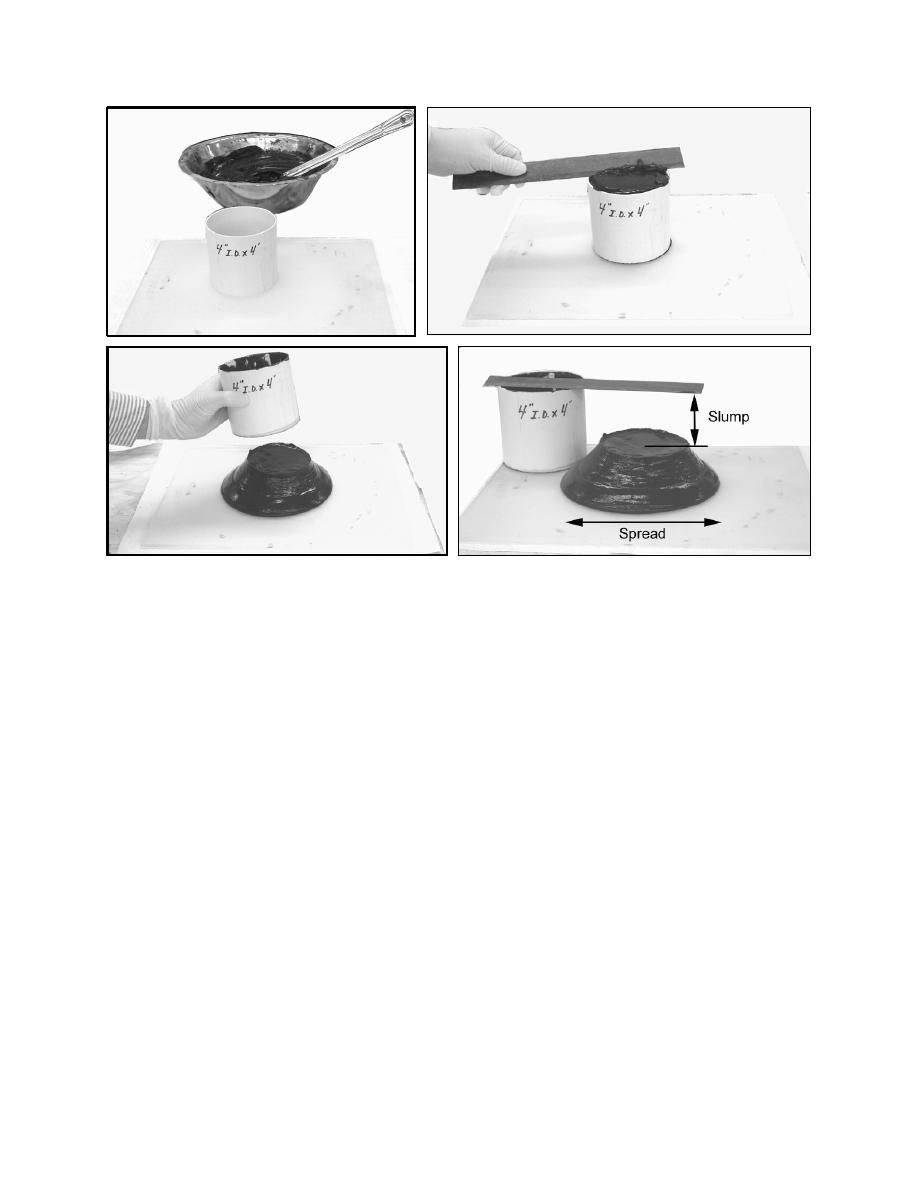
Figure 1. Dredged material slump test sequence |
||
| |||||||||||||||
|
|
 ERDC TN-DOER-D1
August 2004
Figure 1. Dredged material slump test sequence
For each soil sample, the slump test was conducted as quickly as possible to avoid thixotropic
effects, but each cylinder was lifted in a slow manner to avoid tensile failure and to prevent top-
pling. Pre-wetting the cylinder walls had no appreciable effect on the slump height but it helped
prevent material sticking to the walls while lifting the cylinder. Each cylinder was removed in
less than approximately 7 seconds after leveling off the top. Elapsed time during each test, from
the sample preparation to final slump measurement, was typically less than 1 minute.
Figure 2 shows the normalized slump versus water content for various types and locations of
dredged materials. Note that the test results vary as a function of soil type, and since the coarser-
grained soils have less water content variability, the test is most useful for finer-grained soils.
Index property correlations for dredged materials were established by conducting other labora-
tory tests and identifying correlations to normalized slump. When the slump test is combined
with index property correlations, it becomes a useful tool not only to rapidly monitor an individ-
ual material's properties as a function of time, but as a characterization tool for estimating an
unknown dredged material's index properties.
Fine-grained materials were tested using the laboratory vane shear apparatus to determine their
undrained shear strength as a function of water content. Correlation curves for slump, shear
strength, water content, and other properties were then generated for each material tested. Fig-
ure 3 illustrates the laboratory vane undrained shear strength as a function of water content and
liquid limit.
5
|
|
Privacy Statement - Press Release - Copyright Information. - Contact Us - Support Integrated Publishing |
