 |
||
|
|
||
|
Page Title:
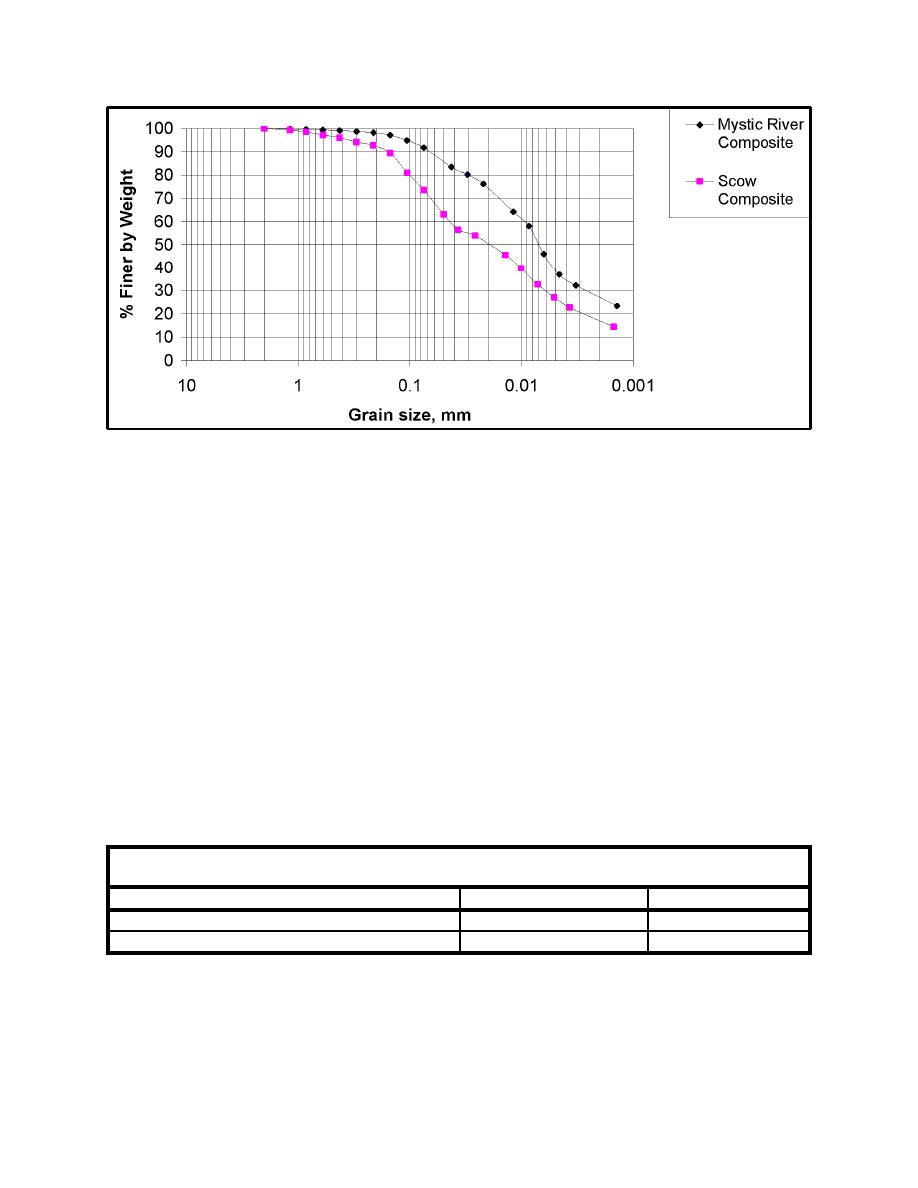
Figure 9. Cumulative grain size distribution (by weight) curves for pre- and post-dredged material samples after mechanical d... |
||
| |||||||||||||||
|
|
 ERDC TN-DOER-D2
September 2004
Figure 9.
Cumulative grain size distribution (by weight) curves for pre- and post-dredged material sam-
ples after mechanical dredging
VARIABILITY DUE TO DREDGED MATERIAL PLACEMENT: In addition to the influence
of spatial variability and dredging operations, the properties of dredged material may change
depending on their final placement or disposal. Variability will be encountered in the placement
process due to the methods and equipment used. For example, sediments transported via pipeline
are layered differently than those placed by clamshell bucket. Also, the placed sediment likely
mixes with native sediment, which changes its properties and subsequent engineering behavior.
Open Ocean Placement. To make a general comparison between properties of pre-dredged
and post-placed sediments deposited at an open (unconfined) ocean site, pre-dredged material
sampled from the Gulf Coast's Mobile Bay was compared to previous data where similar mate-
rial was placed at an open ocean site near the entrance to Mobile Bay (Davis et al. 1999). The
fine-grained material was dredged with a clamshell bucket dredge, transported via split-hull
barge scows, and dumped through an approximate 30-ft (10-m) water column onto a sandy ocean
floor, which had a mean grain size (by weight) of 0.21 mm. Tables 5 and 6 list some of the geo-
technical properties of the pre-dredged and post-placed samples. Figure 10 shows the grain size
distributions.
Table 5
Median and Mean Grain Size (by weight) for Ocean-Placed Sediment Samples
Sample
Median, mm
Mean, mm
Pre-dredged (Mobile Bay)
0.001
0.013
Post-placed (open ocean)
0.015
0.077
9
|
|
Privacy Statement - Press Release - Copyright Information. - Contact Us - Support Integrated Publishing |
