 |
||
|
|
||
|
Page Title:
Figure 11. Cumulative grain size distribution (by weight) curves for pre- dredged and post-placed material samples after mech... |
||
| |||||||||||||||
|
|
 ERDC TN-DOER-D2
September 2004
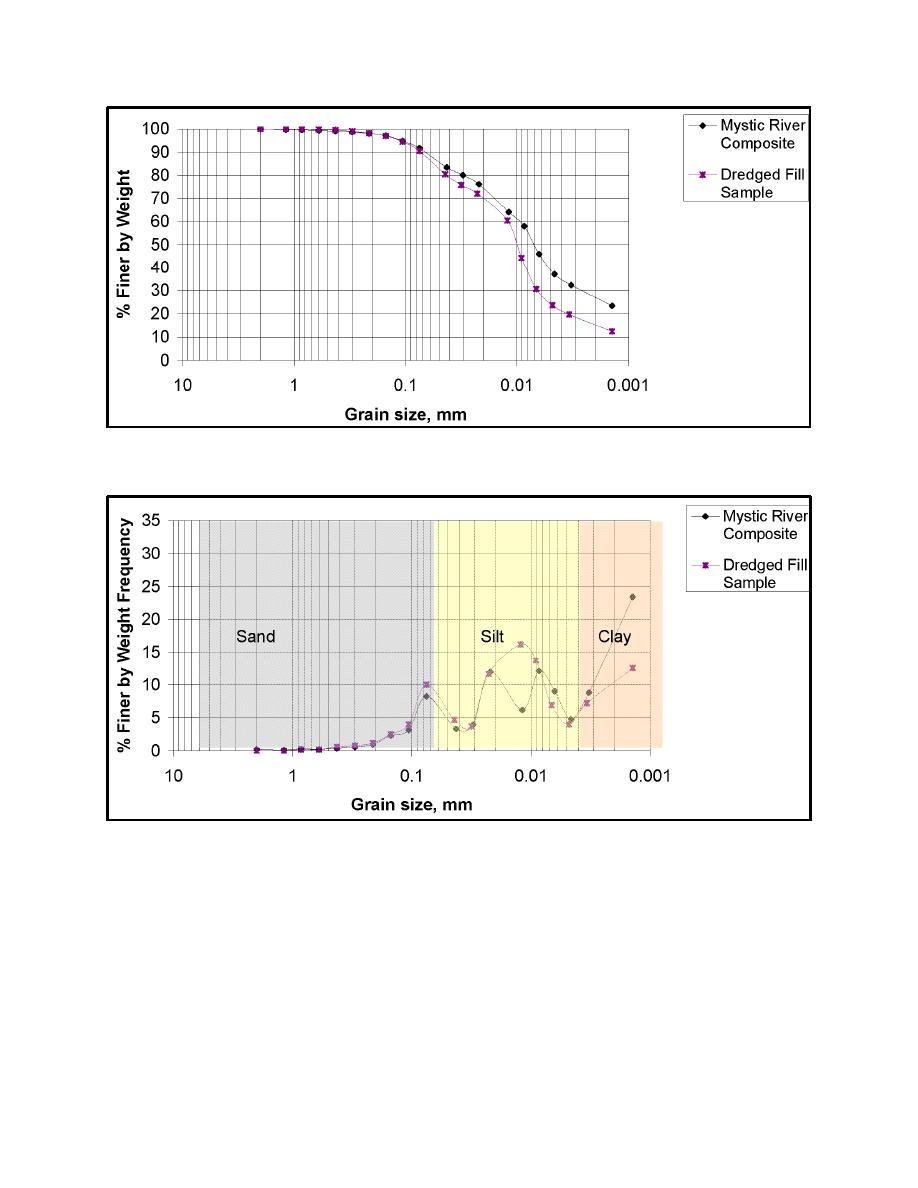
Figure 11. Cumulative grain size distribution (by weight) curves for pre- dredged and post-placed mate-
rial samples after mechanical dredging and dump scow placement
Figure 12. Frequency grain size distribution (by weight) curves for pre- dredged and post-placed mate-
rial samples after mechanical dredging and dump scow placement
The Atterberg limits of the two materials are similar (LL = 90 and PL = 34, plus or minus 2).
The grain size distribution curves are similar except in the fine silt and fine clay ranges. The
dredged fill placed in the subaqueous pit contains 10 percent more fine silt and 10 percent less
fine clay material compared to its pre-dredged composition. Numerous reasons may be
conjectured, including stripping of the fine clay fraction during the dredging and dumping
operations, silting sediment from the channel into the pit, erosion processes, or normal sampling
variations.
11
|
|
Privacy Statement - Press Release - Copyright Information. - Contact Us - Support Integrated Publishing |
