 |
||
|
|
||
|
Page Title:
Table 4. Model Predicted Suspended Sediment Concentration Summary |
||
| |||||||||||||||
|
|
 ERDC TN-DOER-E12
July 2000
Table 4
Model Predicted Suspended Sediment Concentration Summary
At 1.5 Percent
At 2 Percent
At 4 Percent
Release Rate
Release Rate
Release Rate
Depth at
Depth at
Depth at
Maximum
Maximum
Maximum
Maximum
Maximum
Maximum
Dredging
Concen-
Concen-
Concen-
Concen-
Concen-
Concen-
Site
Location
tration
tration
tration
tration
tration
tration
Fox Point
300 m up
16
9
21
9
39
9
Reach
150 m up
22
9
30
9
59
9
Central
Source
54
11
72
11
150
11
(FPRC)
150 m dn
14
5
19
5
35
5
300 m dn
12
1
16
1
30
1
Bullock
300 m up
5.3
7
7.0
7
14
7
Point
150 m up
13
9
17
9
35
9
Reach
Source
20
7
27
7
53
7
South
150 m dn
6.6
9
8.7
9
18
9
(BPRS)
300 m dn
5.7
9
7.6
9
15
9
9
41
9
20
300 m up
15
9
Rumstick
9
51
9
19
9
25
Neck
150 m up
60
9
9
30
9
Reach
Source
22
7
35
7
18
7
Central
150 m dn
13
9
21
9
10
300 m dn
7.3
9
(RNRC)
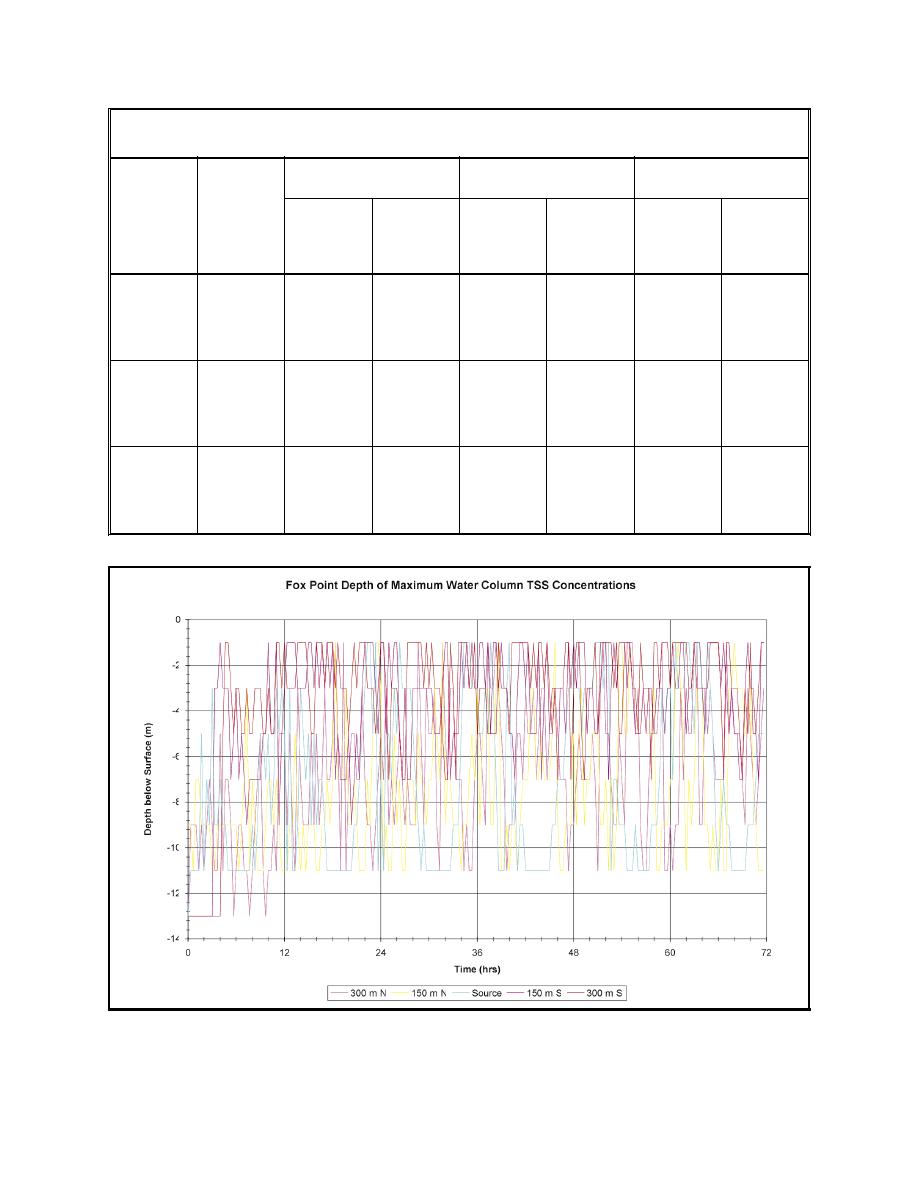
Figure 8. Time history of depth below surface of maximum water column TSS concentrations with bucket
release rate of 1.5 percent at the Fox Point Reach Central (FPRC) site. Also shown are TSS
concentrations 150 m (500 ft) and 300 m (1,000 ft) up and down the channel of the site
12
|
|
Privacy Statement - Press Release - Copyright Information. - Contact Us - Support Integrated Publishing |
