 |
||
|
|
||
|
Page Title:
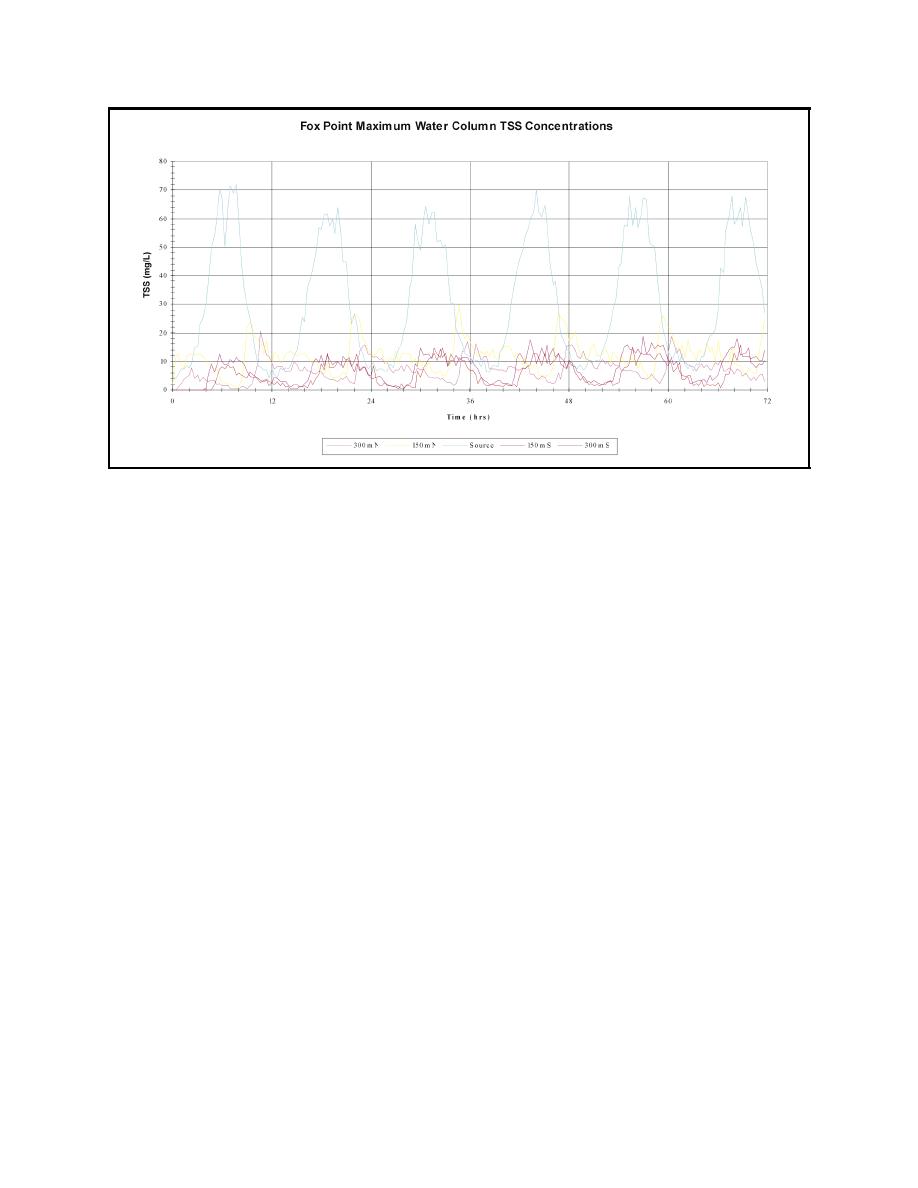
Figure 9. Time history of maximum water column TSS concentrations with bucket release rate of 2 percent at the Fox Point Reac... |
||
| |||||||||||||||
|
|
 ERDC TN-DOER-E12
July 2000
Figure 9. Time history of maximum water column TSS concentrations with bucket release rate of 2 per-
cent at the Fox Point Reach Central (FPRC) site. Also shown are TSS concentrations of 150 m
(500 ft) and 300 m (1,000 ft) up and down chane of the site
Figure 10 shows the time history of water column maximum TSS concentrations as a result of
dredging at the FPRC site with a bucket release rate of 4 percent. Again, the highest concentrations
(peaking at 150 mg/L) occur at the dredging site, with the next highest concentrations being
59 mg/L at 150 m (500 ft) up channel. At 300 m (1,000 ft) up channel, 150 m (500 ft) down channel,
and 300 m (1,000 ft) down channel of the site, maximum concentrations range from 30 to 39 mg/L.
As can be seen from an inspection of Table 4, the maximum concentrations approximately scale to
the strength of the source, e.g., 54 mg/L at a 1.5 percent release rate, 72 mg/L at 2 percent and
150 mg/L at 4 percent.
Figure 11 shows plan views of maximum concentrations computed during the simulation at a depth
of 6-8 m (20-26 ft) and vertical section views through the main axis of the plume at the Bullock
Point Reach South (BPRS) site. As for the Fox Point Reach sites, the plume axis is seen to generally
follow the channel axis. Release rates of 1.5, 2, and 4 percent are shown in the lower, center and
upper panels, respectively. The maximum concentrations at the source are 20, 27, and 53 mg/L for
the 1.5-, 2-, and 4-percent release rates, respectively. The section view is defined by the dashed
line in the plan view. Summary concentration information for this simulation is also presented in
Table 4.
Figure 12 shows plan views of maximum concentrations located at a depth of 8-10 m (26-33 ft) and
vertical section views through the main axis of the plume at the Rumstick Neck Reach Central
(RNRC) site. As for the other two sites, release rates of 1.5 percent, 2 percent and 4 percent are
shown in the lower, center and upper panels, respectively. At this site, the plume axis is seen to be
approximately 25 clockwise from the channel axis due to the direction of the currents at the site
not being aligned with the channel axis. The maximum concentrations at the source are 22, 30, and
60 mg/L for the 1.5-, 2-, and 4-percent release rates, respectively.
13
|
|
Privacy Statement - Press Release - Copyright Information. - Contact Us - Support Integrated Publishing |
