 |
||
|
|
||
|
Page Title:
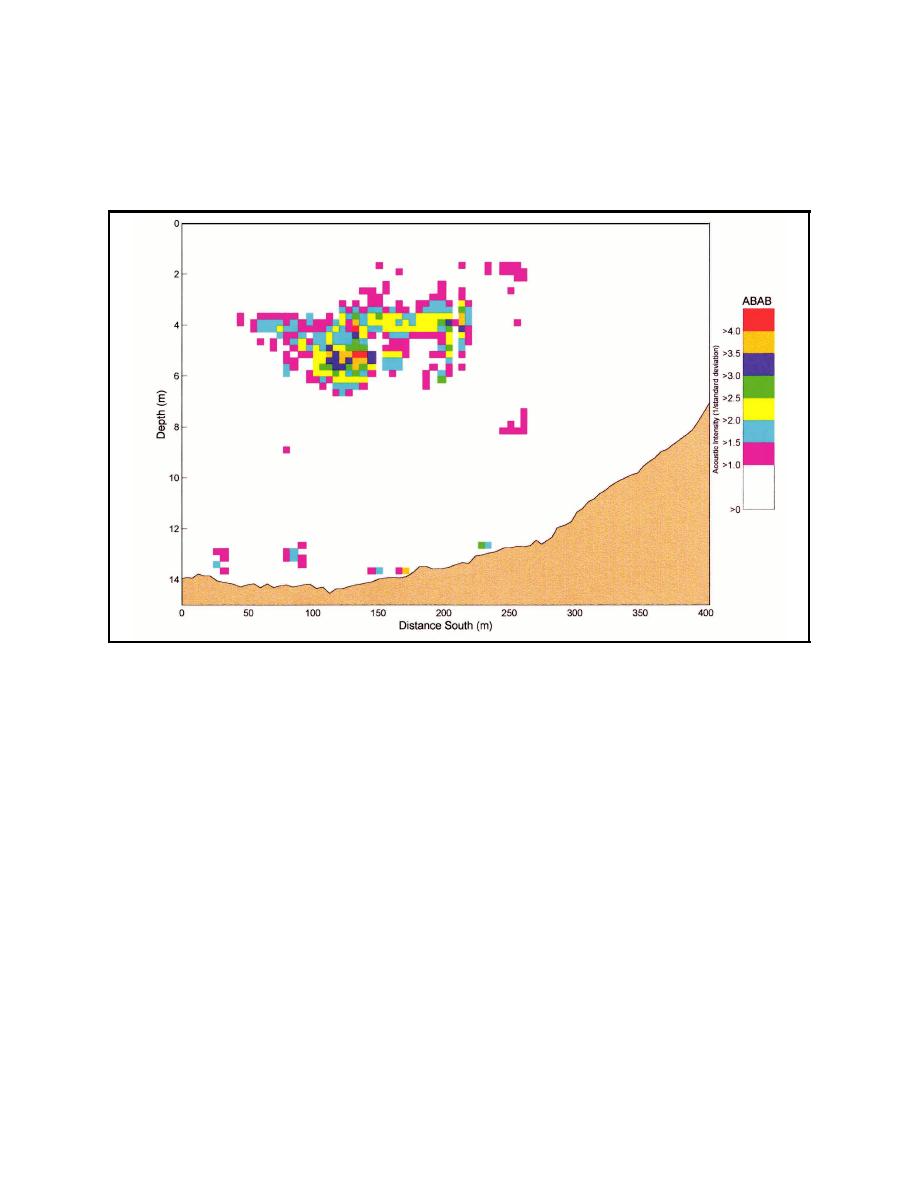
Figure 3. Transect 2, Mobile Bay monitoring |
||
| |||||||||||||||
|
|
 ERDC TN-DOER-E7
April 2000
in ABAB values. Each ABAB value was assigned a color based on an incremental scale of between
0 and 1, 1 to 1.5, 1.5 to 2, 2 to 2.5, 2.5 to 3, 3 to 3.5, 3.5 to 4, and greater than 4 times the standard
deviation above background variations. These are plotted for Transects 2, 6 and 8, in Figures 3, 4,
and 5, respectively.
Figure 3. Transect 2, Mobile Bay monitoring
To accomplish the objective of superimposing fishery hydroacoustic data on plume-monitoring
acoustic data acquired synoptically, a BioSonics DT 4000 Series digital transducer system was used
to make measurements in tandem with the BBADCP. The BioSonics DT is a 200-kHz high-
resolution, high-accuracy echo sounder. It is a computer-controlled and -calibrated system used to
perform acoustic surveys of aquatic and marine fishery resources. Figure 5 shows targets detected
by the system superimposed on ABAB data along Transect 8.
Interpretation of the images presented in Figures 3, 4, and 5 is influenced by the nature of the currents
during the monitoring. The monitoring was performed while the survey vessel followed the Wheeler,
which was dredging while going down the channel toward the Gulf of Mexico. Consequently, the
survey vessel needed to catch up to any suspended sediment plumes created by the dredging if the
currents were ebbing, but a plume could be expected to move northward into the path of the survey
vessel if the currents were flooding. Processing of the BBADCP current data revealed that the flows
measured across Transect 6, which are typical of those measured along all the transects, are shown
in Figure 6. The currents are contoured through points of equal magnitude with positive values
being ebb currents and negative values being flood currents. The passage of the Wheeler down the
channel, and probably its prop wash, have an effect on the current measurements. An asterisk in
5
|
|
Privacy Statement - Press Release - Copyright Information. - Contact Us - Support Integrated Publishing |
