 |
||
|
|
||
|
Page Title:
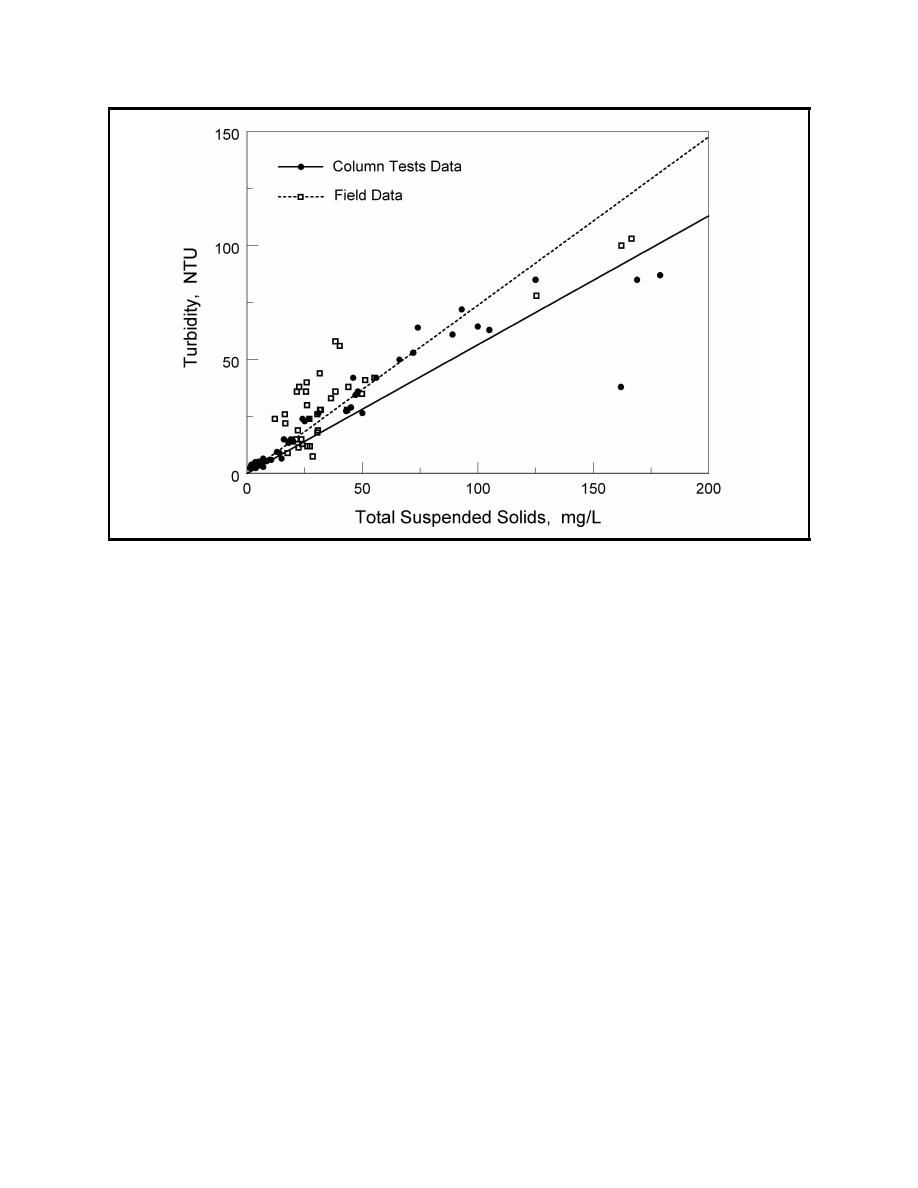
Figure 1. Comparison of laboratory column and field data and linear regression lines for Mobile Bay sediment |
||
| |||||||||||||||
|
|
 ERDC TN-DOER-E8
June 2000
Figure 1. Comparison of laboratory column and field data and linear regression lines for Mobile Bay
sediment
sediment samples. This indicates that the laboratory data curve can be used as a routine operating
aid until sufficient field data are produced to construct a better correlation curve based on field data
alone.
In this situation, the TSS predicted by the column test was slightly higher than the actual TSS
measured in the field for identical turbidities, 70 mg/L versus 52 mg/L in the field. Thus, it is a
conservative predictor, slightly more protective of the environment, which is appropriate. However,
it is not so overly conservative as to be overly restrictive on the dredging contractor.
The differences in the two sets of data, in their lines of best fit, and in the scatter in the data do
emphasize the importance of verifying the accuracy of the laboratory predictions as soon as possible
after dredging starts. Some projects produce better correlations than others. The Mobile Bay data
are fairly typical. An example of a good correlation is shown in Figure 2. As soon as the project
is underway and operating conditions have begun to stabilize, it is critical that field sampling for
both turbidity and TSS begin. A monitoring curve based on or incorporating actual field data should
be produced as soon as possible after dredging starts.
The lines of best fit in Figure 1 are the best fit linear lines, but a cursory examination of the data
reveals that the data do not form a linear pattern over the whole range, but only below approximately
50 mg/L TSS. Correlation curves in the form of exponential equations would fit the data much
better over the whole range, but linear lines were used in this example to illustrate the simplicity of
the technique. Alternatively, only the data below a given value of TSS could be used to produce
8
|
|
Privacy Statement - Press Release - Copyright Information. - Contact Us - Support Integrated Publishing |
