 |
||
|
|
||
|
Page Title:
Dredge Process Data to Monitor Dredge Performance |
||
| |||||||||||||||
|
|
 administrator can use this model in conjunction with the actual monitoring data to insure that the
dredge is meeting minimal production requirements.
Another component essential to the pre-dredge analysis is the dredge pump characteristic curve,
which details the relationship between pump discharge head, discharge, efficiency, horsepower, and
pump speed. Data generated from the theoretical dredge model can be used in conjunction with the
pump curve to determine the approximate pump operating point during the project. This is essential
to insuring that the pump operates above the minimum flow rate for settling of solids in the pipeline
and that horsepower limitations are not a controlling factor.
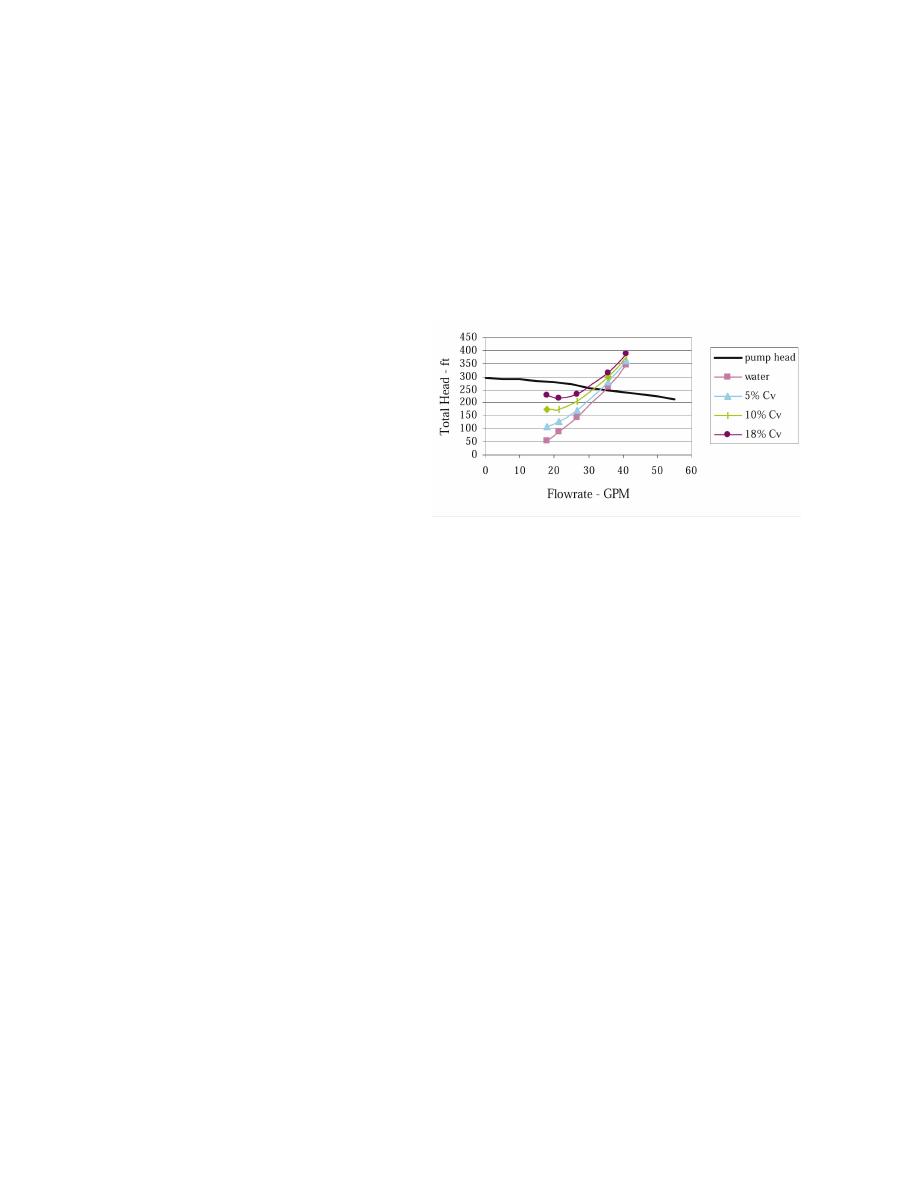
Figure 1 is an example of the pump curve
for a 0.68- by 0.68-m- (27- by 27-in.-)
dredge pump with a 2,134-m- (7,000-ft-)
long discharge line at the maximum pump
speed, 575 rpm. The maximum pump
power available is 2,237 kW (3,000 hp).
The system head requirement curves gen-
erated from a dredge performance model
are plotted on the pump curve. These
curves represent water in the pipe, 5 per-
cent by volume solids slurry, 10 percent
by volume solids slurry, and 18 percent by
volume solids slurry. The sand size is
0.16 mm (0.0006 in.), with a critical velocity of deposition in the 0.68-m (27.0-in.) pipe of about
3.66 m/sec (12.0 ft/sec) or 81,052 L/min (21,414 gpm).
The pump will operate at the intersection of the system curves and the pump curve. The 18 percent
solids system curve intersects the pump curve at a head of about 255 ft of water and a discharge of
approximately 113,550 L/min (30,000 gpm) (5.12 m/sec (16.8 ft/sec) flow velocity in the pipeline).
This dredge is capable of pumping the maximum concentration of solids (18 percent) at a velocity
above the minimum velocity required to prevent deposition in the pipeline. Dredge production is
approximately 1,618 m3/hr (2,115 yd3/hr) with 2,152 kW (2,886 hp) required.
In summary, dredge performance can be estimated using the dredge performance model in
conjunction with the pump characteristics curve. The model provides estimated values of slurry
density (solids concentration) and dredge production during each phase of the dredging cycle. These
values can be compared to the real-time slurry density and velocity data acquired from the production
meter on the dredge.
Dredge Process Data to Monitor Dredge Performance. A number of monitoring systems
can be used on a pipeline dredge to assist in maintaining dredge production (Pankow 1989). The
most common instrumentation for monitoring solids transport are the velocity meter and slurry
density gauge. The velocity of the dredged slurry in the pipeline can be measured with a variety of
types of flow meters. The slurry velocity data alone is not descriptive of the efficiency of the dredge
plant, but when evaluated in conjunction with the slurry density measurement, a relative measure
of dredge production rate can be made.by
|
|
Privacy Statement - Press Release - Copyright Information. - Contact Us - Support Integrated Publishing |
