 |
||
|
|
||
|
Page Title:
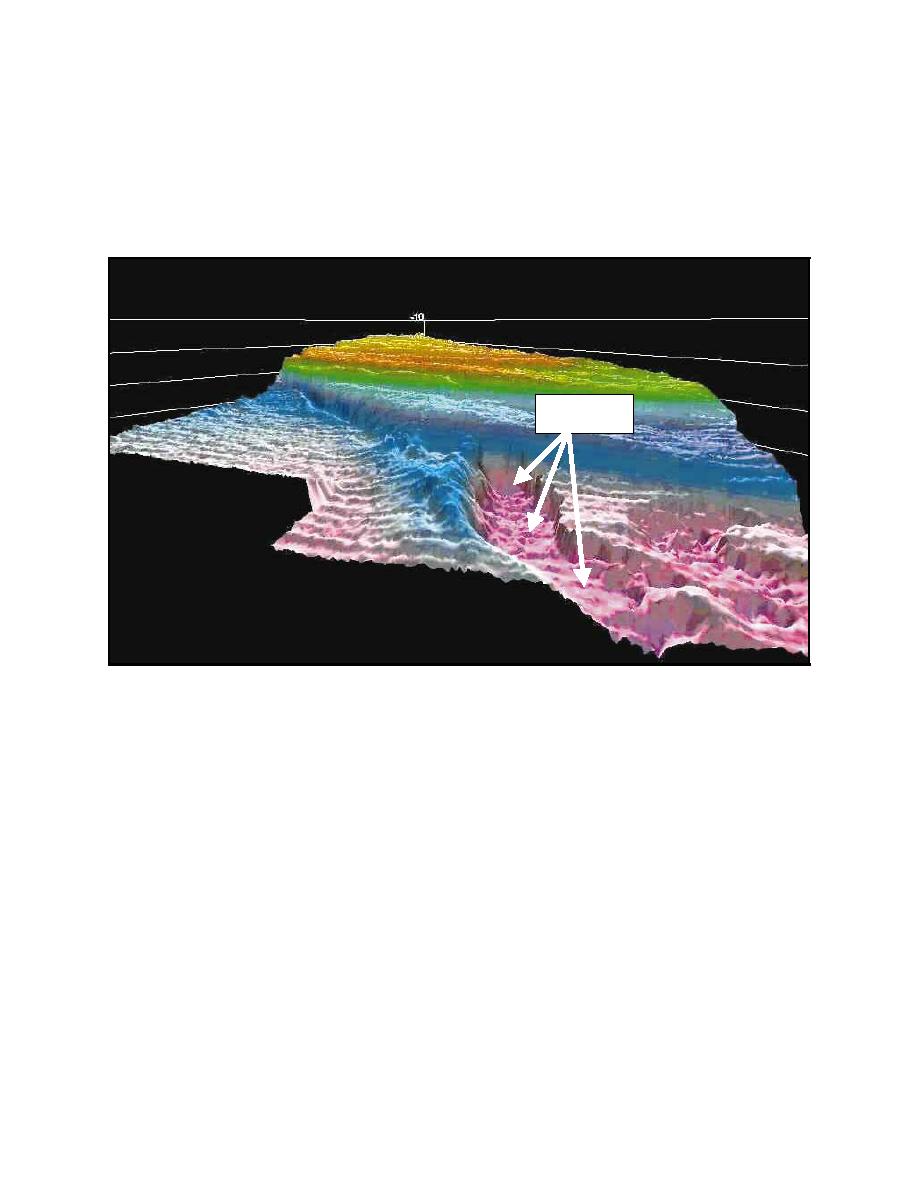
Figure 2. Preplacement bathymetry taken in October 1998 |
||
| |||||||||||||||
|
|
 ERDC TN-DOER-N6
March 2000
in the overwash area. Stone et al. (1999) reported waves exceeding 9.9 m (32.8 ft) off the
Mississippi/Louisiana coast with a storm surge between 1.9-2.9 m (6.1-9.8 ft). In October,
following the hurricane, a multibeam bathymetric survey was taken of the study area and served as
the preproject baseline survey. The survey identified a trench in the side of the ebb shoal that formed
during the hurricane. The trench was within the limits of the planned placement area, so the
placement area was relocated to the west (Figure 2).
Trench
Figure 2. Preplacement bathymetry taken in October 1998
After placement of the dredged material, three additional multibeam bathymetric surveys were
collected. The first survey was conducted in December 1998 immediately after the placement
operations terminated. This survey covered the same area as the predisposal survey of October
1998. The December survey did not capture the entire trench near the placement site, so the next
survey conducted in March 1999 was extended to include most of the trench. The third survey was
taken in May 1999 and covered a even larger area (Figure 3). The surveys show that the mound
created by the dredged material is on the southwest edge of the ebb shoal and along the -9-m- (-30-ft-)
mllw contour. The mound had an irregular footprint, and the highest peaks in the mound surface
were at -8 m (-27 ft) mllw.
The placement area was a square, roughly 305 m (1,000 ft) on each side. Figure 4 shows the change
in bathymetry before and after placement. The mound is characterized by several peaks showing
the difference in depth after placement. A notable flat area is the floor of the trench, which shows
that some sediment moved there between surveys. Little change in bathymetry can be detected
outside of the placement area. From the surveys, it also appears that the mound has changed little
in shape since placement. There has been only slight rounding of the peaks during the study period
3
|
|
Privacy Statement - Press Release - Copyright Information. - Contact Us - Support Integrated Publishing |
