 |
||
|
|
||
|
Page Title:
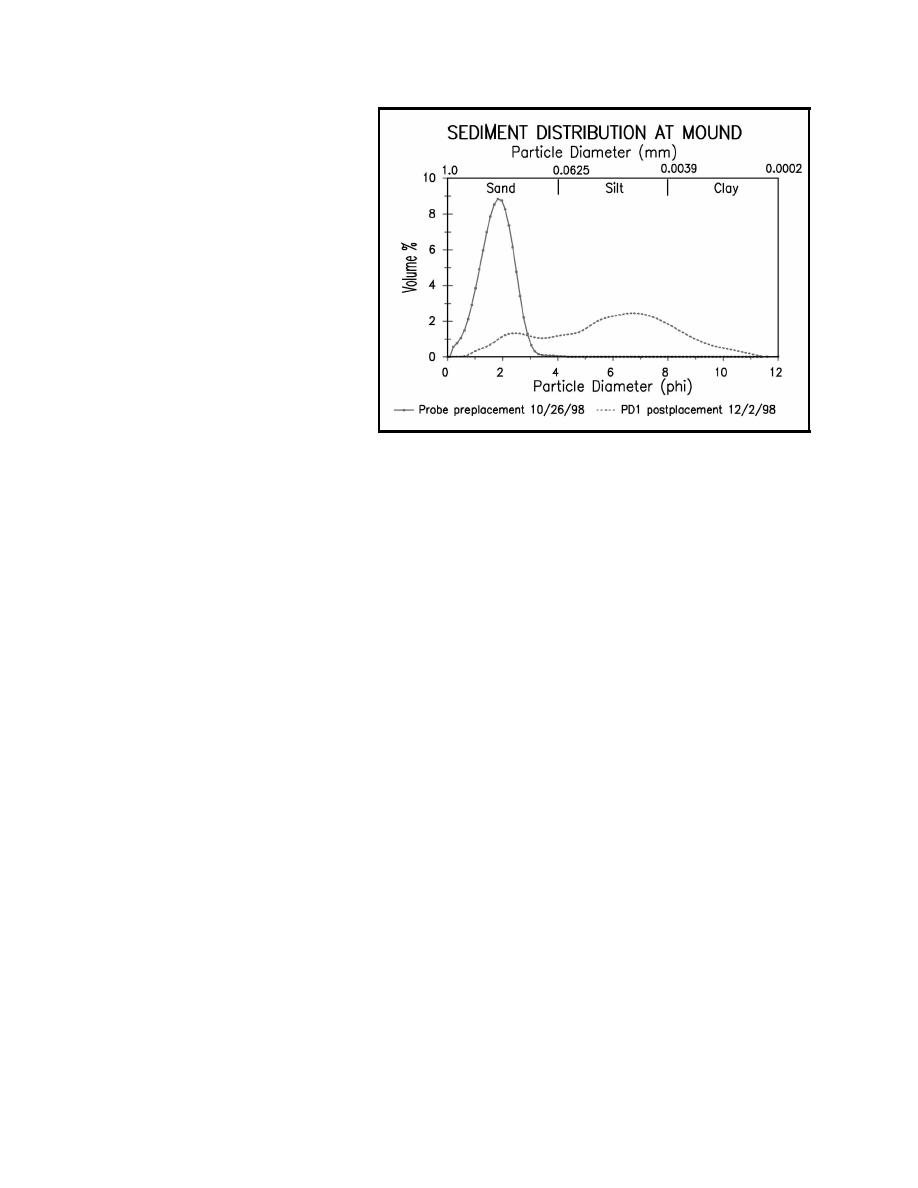
Figure 6. Comparison of grain-size distribution for sandy native ebb shoal sediments and the finer dredge material sediments |
||
| |||||||||||||||
|
|
 ERDC TN-DOER-N6
March 2000
Current Velocity and Direction
Measurements. A 1,500-kHz
(ADP) was installed in the study
area prior to placement of the
dredged material to obtain current
velocity and direction. The ADP
was mounted in a stable housing and
placed on the seabed. A water level
recorder in a subsurface case re-
corded the absolute pressure of the
water column above the instrument
from which waves and water levels
were derived. The pressure was
corrected for barometric pressure
via another pressure gauge located
to record atmospheric pressure Figure 6. Comparison of grain-size distribution for sandy native
ebb shoal sediments and the finer dredge material
changes. The water level gauge
sediiments
sampled at 1 Hz for 1,024 sec every
hour. The barometer sampled pressures over 1 min and formed an average, which was then used
to correct the water level gauge pressures. Each recorder stored the information on a data logger
located in the waterproof subsurface unit. The velocity and water level data were retrieved every
4 to 6 weeks.
Water level and wave data were collected almost continuously for the period from the end of October
1998 through July 1999. Tidal currents were recorded during that period as well, but problems with
sediment accumulation on the gauge limited the amount of useful data. The data are summarized
in the following paragraphs.
The Wave Information Study (WIS) (Hubertz and Brooks 1989) hindcast summary data for Station
27 in the Gulf of Mexico, which is 24-32 km (15-20 miles) south of the study area, are presented
in Table 5 (after Hubertz and Brooks 1989). The table provides the monthly maximum significant
wave height hindcast for each year between 1956 and 1975 and the means of significant wave height
for each month (averaged over the 20-year hindcast record). The significant wave height maximums
and means measured by the wave gauge and analyzed for this period are also provided. The
measured data tend to be lower than the hindcast data. One likely reason for this is that the WIS
station is at 24-32 km (15-20 miles) south of the study site. Waves from the north then would be
larger at Station 27 than at the study site because of the longer fetch to the WIS station. Waves
from the north occur less frequently, as the dominant wave direction is from the southeast. Another
likely reason is simply that the weather during this period was mild. The average peak periods of
the measured waves were between 5 and 6 sec, which is consistent with the hindcast data.
Tidal and meteorologically induced currents were measured during the study period. Only the
months of December, January, and March provided useful data. Table 6 provides the summary data
regarding the currents for those months. The currents contain a north-south diurnal oscillation as
water moves in and out of Mobile Bay.
9
|
|
Privacy Statement - Press Release - Copyright Information. - Contact Us - Support Integrated Publishing |
