 |
||
|
|
||
|
Page Title:
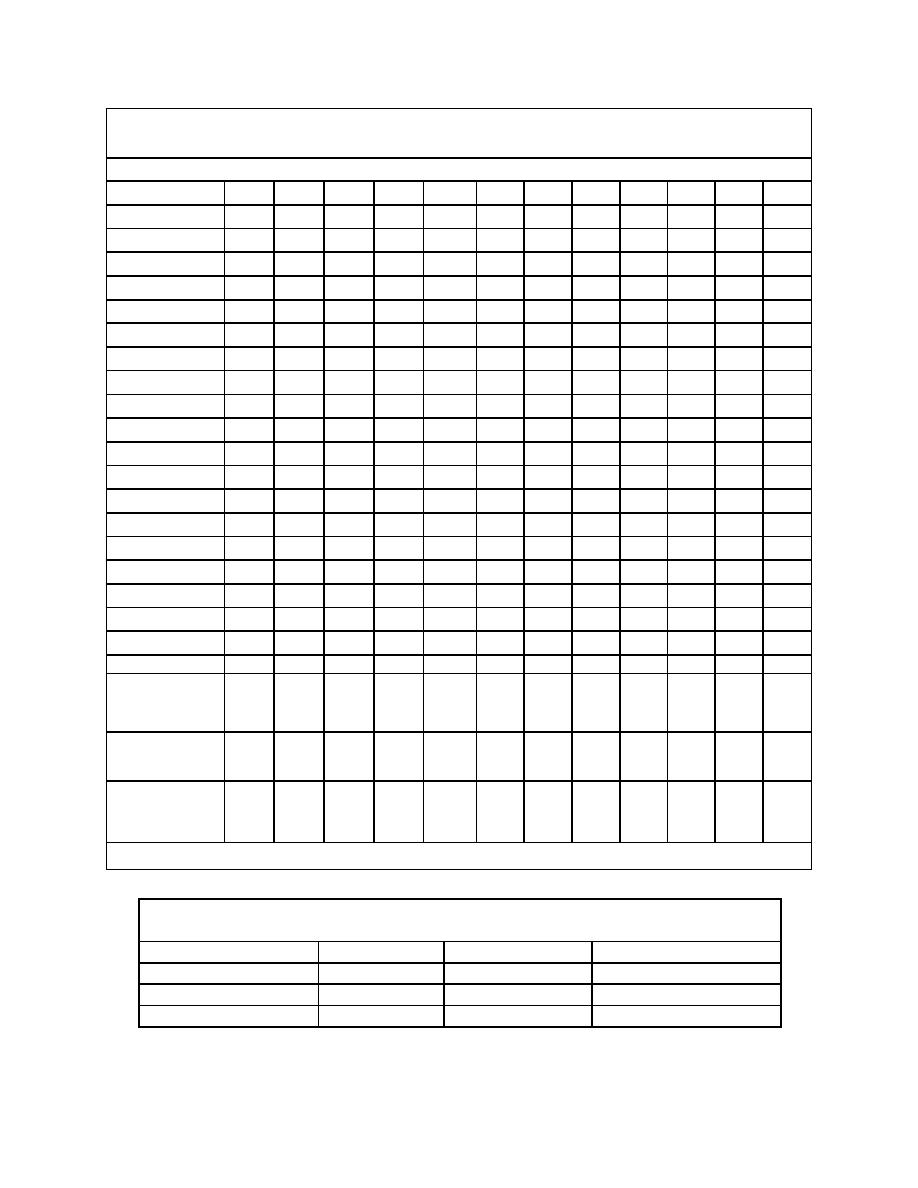
Table 5. Measurements & WIS hindcast comparisons |
||
| |||||||||||||||
|
|
 ERDC TN-DOER-N6
March 2000
Table 5
Measurements & WIS hindcast comparisons
WIS Significant Wave Height Maximums, m
Year
Jan
Feb
Mar
Apr
May
Jun
Jul
Aug
Sep
Oct
Nov
Dec
1956
2.2
2.6
2.4
2.9
1.8
2.2
1.3
1.4
2.5
2.1
2.0
2.2
1957
2.2
2.2
2.2
3.4
2.0
2.9
1.1
2.4
3.3
2.7
2.9
2.9
1958
3.3
2.7
3.1
2.4
1.8
1.7
1.3
1.4
2.5
2.3
2.0
2.9
1959
4.2
2.0
3.1
1.7
2.0
1.8
1.5
1.3
2.4
2.4
2.2
2.4
1960
2.3
3.6
2.1
1.9
2.2
1.6
1.0
1.6
2.1
1.7
1.9
2.7
1961
2.4
2.6
2.2
2.2
1.7
2.7
1.0
1.6
3.0
2.2
2.8
3.1
1962
2.7
2.7
2.3
2.1
1.7
1.0
1.1
1.3
1.7
1.7
2.3
2.6
1963
2.4
2.5
2.8
2.0
1.6
1.5
1.2
1.4
2.6
1.6
2.8
2.6
1964
2.6
2.6
3.8
2.6
1.5
1.2
1.5
1.2
1.9
2.7
2.4
3.0
1965
2.3
3.0
2.4
1.8
1.5
2.1
1.1
1.4
4.1
2.2
2.4
2.4
1966
3.0
4.1
2.5
2.6
2.3
1.4
1.1
1.7
1.7
2.0
2.6
2.7
1967
2.5
2.0
2.8
2.4
2.1
1.2
1.0
1.3
2.1
3.0
2.0
2.5
1968
2.3
2.5
3.7
2.4
2.1
1.2
1.0
1.2
1.8
1.7
2.9
3.0
1969
2.4
3.3
3.3
2.9
1.7
1.3
1.2
2.9
1.8
2.9
2.4
3.3
1970
3.0
3.6
3.5
3.4
1.8
1.8
1.1
1.8
1.8
2.3
2.5
2.3
1971
2.9
3.2
2.3
2.2
2.4
1.4
1.4
1.1
2.3
1.8
2.1
3.1
1972
2.8
2.4
2.8
2.2
2.2
1.9
1.7
1.2
2.1
3.0
2.7
3.1
1973
3.6
3.9
4.7
3.3
3.4
1.1
1.2
1.2
2.5
2.3
3.0
3.8
1974
2.3
3.6
2.2
3.7
2.9
1.8
0.9
1.5
3.3
2.8
2.3
2.8
1975
4.0
2.9
3.3
3.1
1.6
1.7
2.2
2.3
2.9
2.1
2.8
3.3
Measured
2.5
1.3
2.4
2.2
2.4
1.5
1.4
Na*
Na*
Na*
2.1
1.9
Max. (1998-
99)
WIS Means
1.4
1.3
1.3
1.2
0.9
0.8
0.7
0.8
1.1
1.2
1.3
1.4
(over 20 yr)
Measured
0.8
0.5
0.7
0.7
0.6
0.6
0.5
Na*
Na*
Na*
0.6
07
Means
(1998-99)
* Na = not available.
Table 6
Tidal and meteorologically induced currents
Period
Mean, m/s
Maximum, m/s
Std. Deviation, m/s
0.16
0.53
0.08
December 1998
0.19
0.82
0.10
January 1999
0.20
0.60
0.10
March 1999
10
|
|
Privacy Statement - Press Release - Copyright Information. - Contact Us - Support Integrated Publishing |