 |
||
|
|
||
|
Page Title:
Table 1. Contaminant Dosing for HepG2 Cells (Nominal Concentrations) |
||
| |||||||||||||||
|
|
 ERDC TN-DOER-R4
September 2004
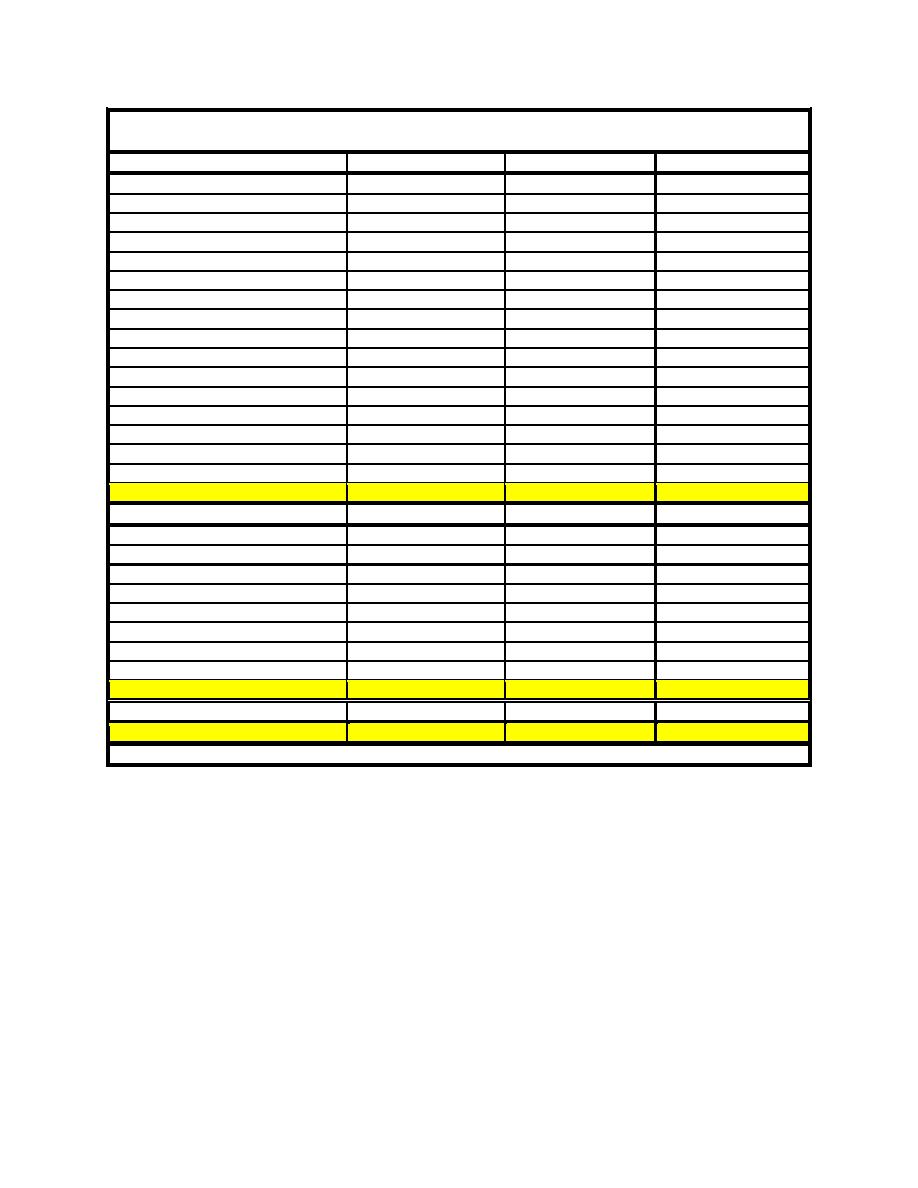
Table 1
Contaminant Dosing for HepG2 Cells (Nominal Concentrations)
PM180 Mixture Component list
High PAH (ug/L)
Mid PAH (ug/L)
Low PAH (ug/L)
acenaphthene
251
25.1
2.5
acenaphthylene
251
25.1
2.5
anthracene
251
25.1
2.5
benz[a]anthracene
25
2.5
0.3
Benzo[b]fluoranthene
25
2.5
0.3
Benzo[k]fluoranthene
13
1.3
0.1
Benzo[ghi]perylene
25
2.5
0.3
Benzo[a]pyrene
25
2.5
0.3
chrysene
25
2.5
0.3
dibenz[a,h]anthracene
25
2.5
0.3
fluoranthene
25
2.5
0.3
fluorene
251
25.1
2.5
indeno[1,2,3-cd]pyrene
25
2.5
0.3
naphthalene
251
25.1
2.5
phenanthrene
251
25.1
2.5
pyrene
25
2.5
0.3
SUM PAH
1740 ug/L
174.0 ug/L
17.4 ug/L
1
Aroclor 1254 (C12H(10-x)Clx)
High Aroclor (ug/L)
Mid Aroclor (ug/L)
Low Aroclor (ug/L)
x=2
0.24
0.024
0.0024
x=3
1.26
0.126
0.0126
x=4
10.25
1.025
0.1025
x=5
59.12
5.912
0.5912
x=6
26.76
2.676
0.2676
x=7
2.66
0.266
0.0266
x=8
0.04
0.004
0.0004
x=9
0.04
0.004
0.0004
SUM PCBs
100 ug/L
10 ug/L
1 ug/L
High TCDD
Mid TCDD
Low TCDD
2,3,7,8-TCDD
100 ng/L (311 pM)
25 ng/L (78 pM)
7.5 ng/L (23 pM)
1
Aroclor1254 components are listed by the number of chlorines rather than the individual polychlorinated biphenyl congeners.
The data were then analyzed using a semi-parametric technique that uses local regression to
estimate the normalized expression levels as well as the expression level-dependent error
variance (Kepler et al. 2002). The technique is based on assumptions that the large majority of
genes will not have their relative expression levels changed from one treatment group to the next,
and that departures of the response from linearity are small and vary slowly. For each compound,
gene responses at each dose were compared to controls independently. The statistical data and
gene expression data were then examined to determine which genes were responding
consistently across all doses.
3
|
|
Privacy Statement - Press Release - Copyright Information. - Contact Us - Support Integrated Publishing |
