 |
||
|
|
||
|
Page Title:
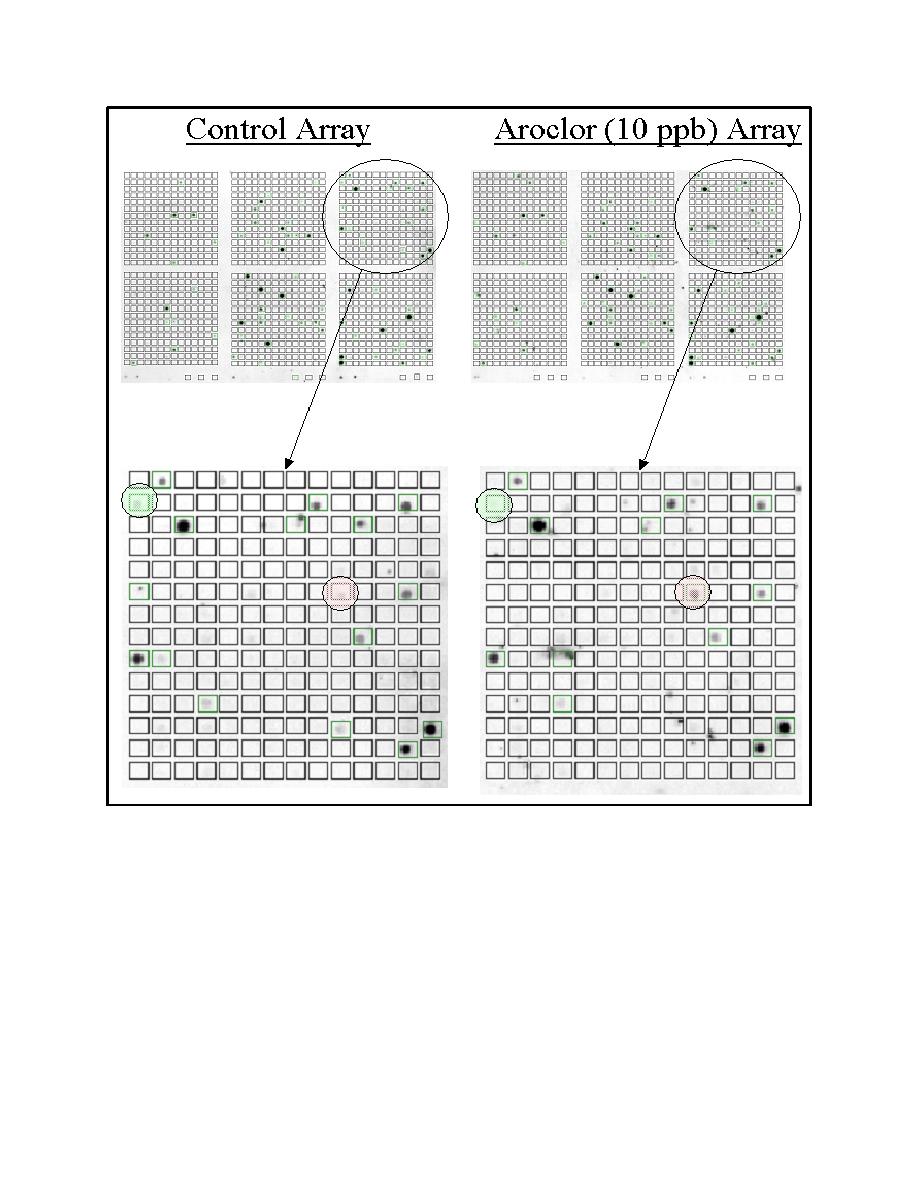
Figure 2. Example arrays. Photos at the top of the figure are from the Aroclor (PCB mixture) exposure; only the control and 1... |
||
| |||||||||||||||
|
|
 ERDC TN-DOER-R4
September 2004
Figure 2.
Example arrays. Photos at the top of the figure are from the Aroclor (PCB mixture) exposure;
only the control and 10-ppb dose are shown. One sector is enlarged to show details, with
examples of up regulation (increase in gene expression, highlighted in red circle) and down
regulation (decrease in gene expression, highlighted in green circle)
RESULTS AND DISCUSSION: Gene responses are dependent on the exposure time, exposure
dose, and contaminant being investigated. Choice of the 16-hr time point for observations in this
study was operationally based. Logistically, post-exposure washing and counting procedures
make it difficult to time exposures with a precision better than +/- 30 minutes. Additionally,
investigations of the time course of gene expression in HepG2 cells have shown that many genes
are approaching maximal induction by 8 to 18 hr, as monitored by real-time PCR (RT-PCR)
(Frueh et al. 2001).
5
|
|
Privacy Statement - Press Release - Copyright Information. - Contact Us - Support Integrated Publishing |