 |
||
|
|
||
|
Page Title:
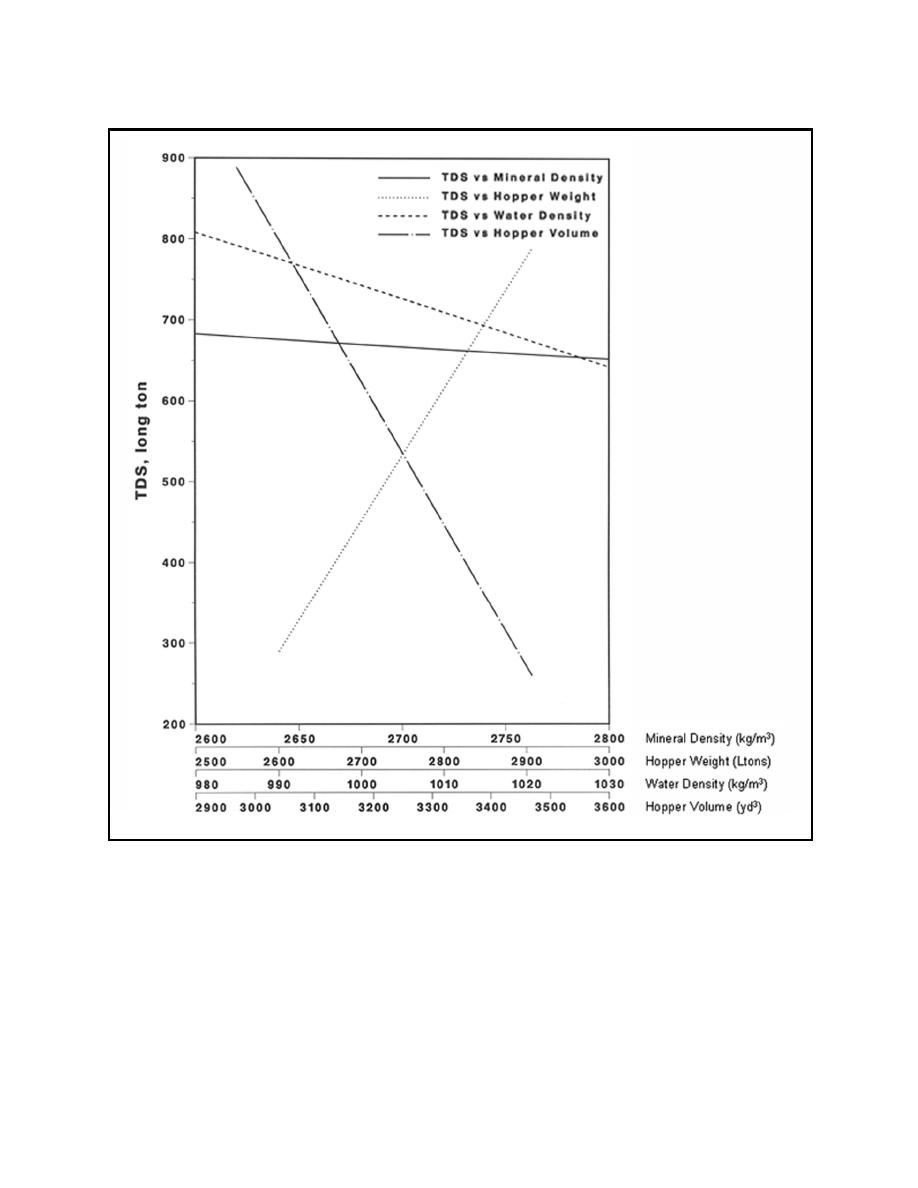
Figure 8. TDS sensitivity analysis |
||
| |||||||||||||||
|
|
 ERDC TN-DOER-T6
September 2004
Figure 8.
TDS sensitivity analysis
respective calculated TDS values of 805 kg/m3 and 640 kg/m3), the respective change in TDS is
165 LT. Given the mineral and water density ranges that are encountered in the field, it can be
seen that mineral density value has the smallest effect on the final calculated TDS value.
On the hopper volume curve, by using the McFarland's ullage table/hopper volume relationship
in the TDS equation, a change of 0.1 ft ullage equates to a change of approximately 16 LT TDS.
For the hopper weight curve, application of the McFarland's draft/displacement relationship in
the TDS equation produces a change of approximately 80 LT TDS per 0.1-ft change in draft.
Evidently the draft measurement, which is used to determine the hopper content weight by
12
|
|
Privacy Statement - Press Release - Copyright Information. - Contact Us - Support Integrated Publishing |
