 |
||
|
|
||
|
Page Title:
Figure G11. Idealized mound cross sections showing maximum and average vertical erosion and areas over which erosion volume i... |
||
| |||||||||||||||
|
|
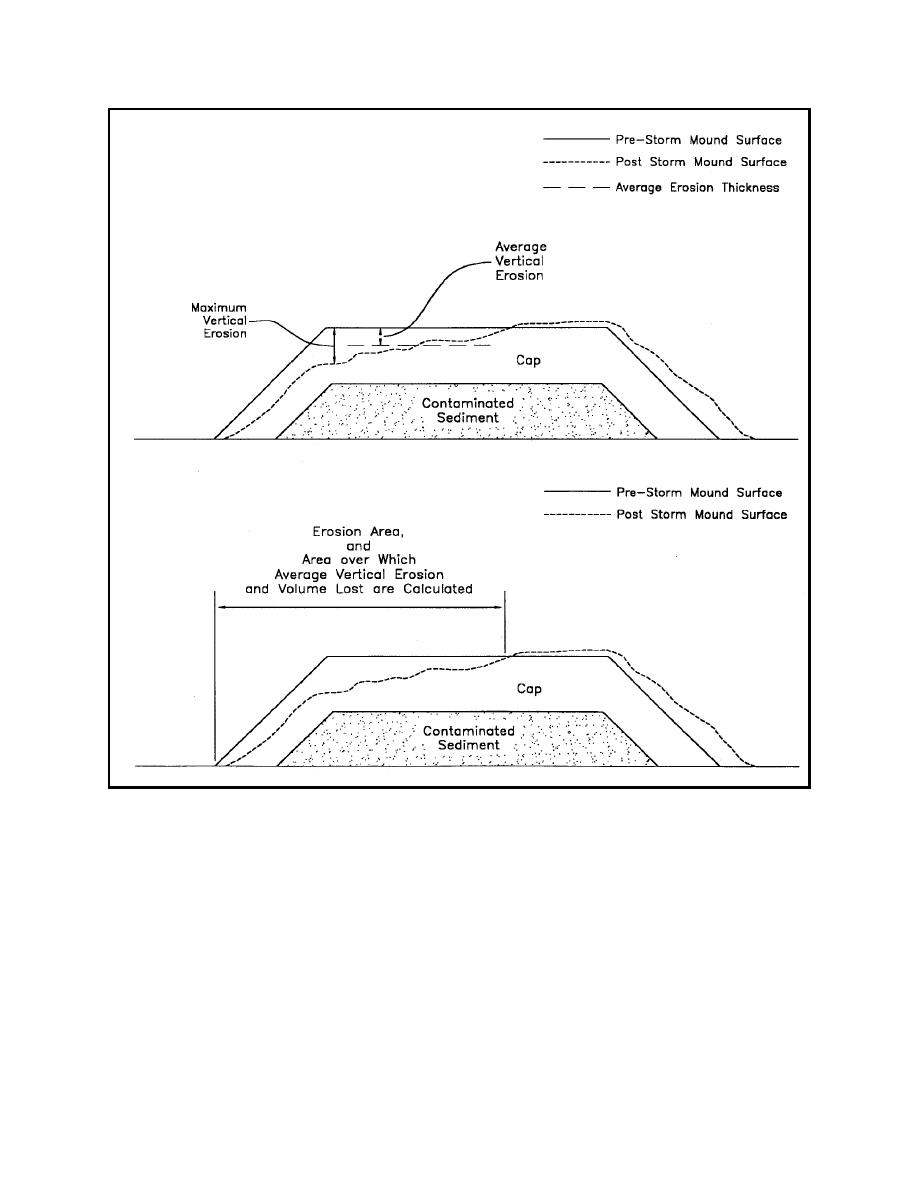 Figure G11. Idealized mound cross sections showing maximum and average vertical erosion and areas
over which erosion volume is computed
if in fact, this more complicated method of computing annual and cumulative
erosion estimates provides significantly different answers than the simpler
methods.
Episodic erosion. Episodic event erosion was individually described for
tropical and extratropical events in the prior sections. For tropical events, the
curves and tables represent the vertical erosion associated with individual hurri-
canes. For example, a 100-year erosion value is the erosion associated with a
single severe event with a return period of 100 years. However, the curves and
tables presented for the extratropical events represent erosion due to multiple
G29
Appendix G Procedures for Conducting Frequency-of-Erosion Studies
|
|
Privacy Statement - Press Release - Copyright Information. - Contact Us - Support Integrated Publishing |
