 |
||
|
|
||
|
Page Title:
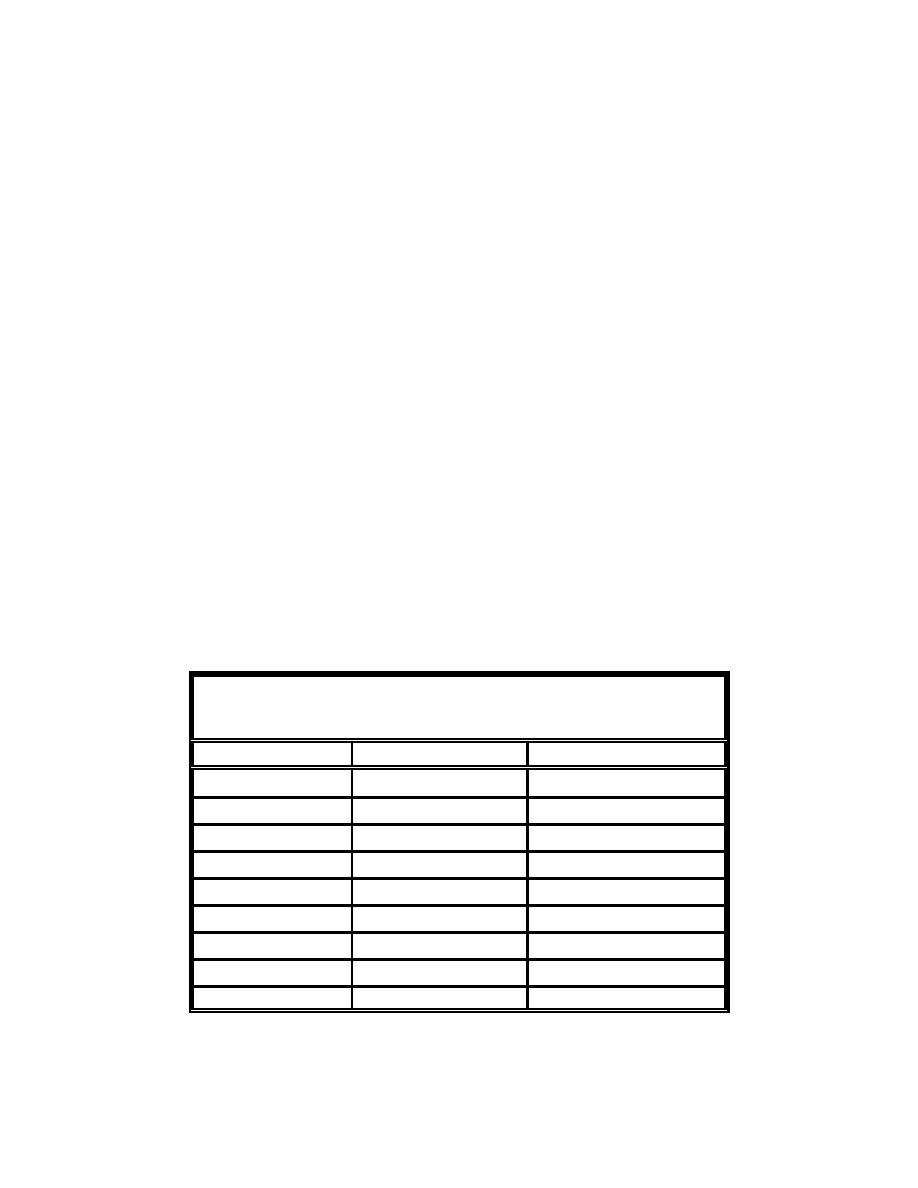
Table H2. Final Statistics of Cap Thickness from Port Newark/Elizabeth Project (March 1994) |
||
| |||||||||||||||
|
|
 is assumed for calculations, in reality, the cap thickness is a distribution, with an
average value and the actual cap depth in specific cells (say 50 by 50 m)
probably following a Gaussian distribution. For example, if a 1-m-thick cap is
specified and the standard deviation of cap thickness is 15 cm (6 in.), after
100 percent of the level cap volume has been placed, 99 percent of the contami-
nated footprint would have 0.55 m of cap, 95 percent would have 0.70 m of cap,
67 percent would have 0.85 m of cap, 50 percent would have 1.0 m of cap,
33 percent would have 1.15 m of cap, 5 percent would have 1.3 m of cap, and
1 percent would have 1.45 m of cap. Should more cap material be placed?
It is recommended that the cap be considered complete if all the contaminated
sediment has a minimum thickness equal to thickness required for chemical
isolation and bioturbation plus some agreed on thickness, say 5 to 10 cm, to
account for elevation variation within a given cell. The reason this procedure is
acceptable is that during storms, it is extremely likely that the high spots on the
cap will erode first and fill in the low areas. Thus, the requirement to place
material in excess of the "level surface cap volume" should be unnecessary.
In addition to the large amount of additional material placed to meet the
requirement to achieve 100-percent thickness everywhere over a cap, this
requirement will also dictate repeated monitoring, which is also expensive.
Finally, the actual placement process becomes less efficient as the vessel placing
the cap material attempts to cover a smaller and smaller area. Statistics from the
capping effort at the Port Newark/Elizabeth project (Table H2), where the goal
was to place 1-m-thick cap over the entire contaminated mound, indicated that an
additional 25 percent over the level cap volume was required to achieve full cap
thickness coverage at over 90+ percent of the area, resulting in cap thicknesses
of over 1.25 m over almost 40 percent of the area.
Table H2
Final Statistics of Cap Thickness from Port Newark/Elizabeth
Project (March 1994)
Cap Thickness, m
Percent of Area Covered
Cumulative Coverage, Percent
0.00 - 0.25
0.0
0.0
0.25 - 0.50
0.2
0.2
0.50 - 0.75
2.9
3.1
0.75 - 1.00
16.4
19.5
1.00 - 1.25
42.2
61.7
1.25 - 1.50
30.4
92.1
1.50 - 1.75
6.5
98.6
1.75 - 2.00
1.1
99.7
2.00 - 2.25
0.1
99.8
H8
Appendix H Level-Bottom Capping Projects
|
|
Privacy Statement - Press Release - Copyright Information. - Contact Us - Support Integrated Publishing |
