 |
||
|
|
||
|
Page Title:
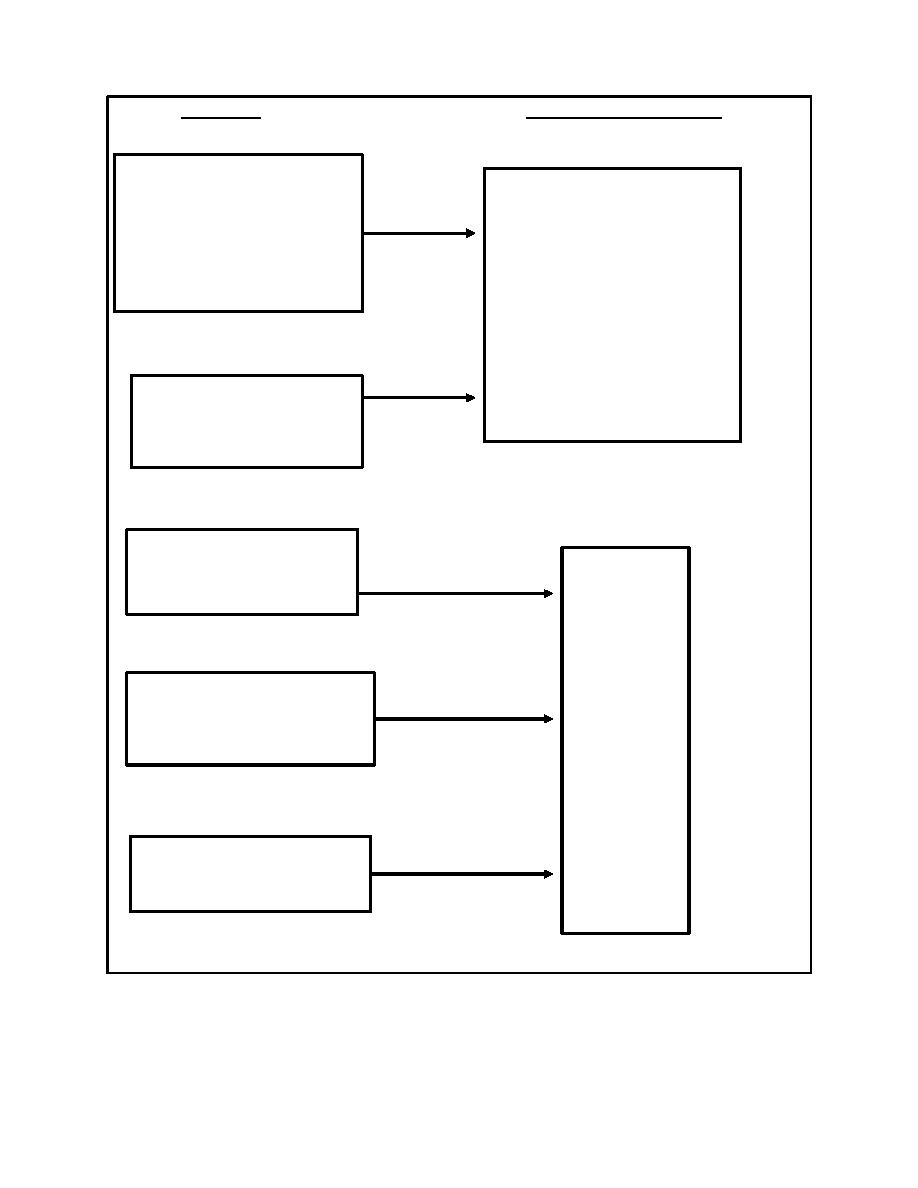
Figure 2. Flowchart depicting relationship between information collected during sediment evaluation process and goals of conc... |
||
| |||||||||||||||
|
|
 Information
Goals of the Conceptual Model
Tier I
Summary of chemical, physical, and
biological testing
Summary of field monitoring
Source description
Review of regulatory files and permits
Characterize the environmental setting
Tier II
Evaluate water quality criteria
Tier II
Calculate theoretical
bioaccumulation potential
Tier III
Select appropriate test organisms
Describe complete
Calculate initial mixing
exposure pathways
Benthic bioaccumulation
Tier IV
Steady-state bioaccumulation
Figure 2.
Flowchart depicting relationship between information collected during sediment evaluation
process and goals of conceptual model
20
Chapter 2 Problem Formulation
|
|
Privacy Statement - Press Release - Copyright Information. - Contact Us - Support Integrated Publishing |
