 |
||
|
|
||
| |||||||||||||||
|
|
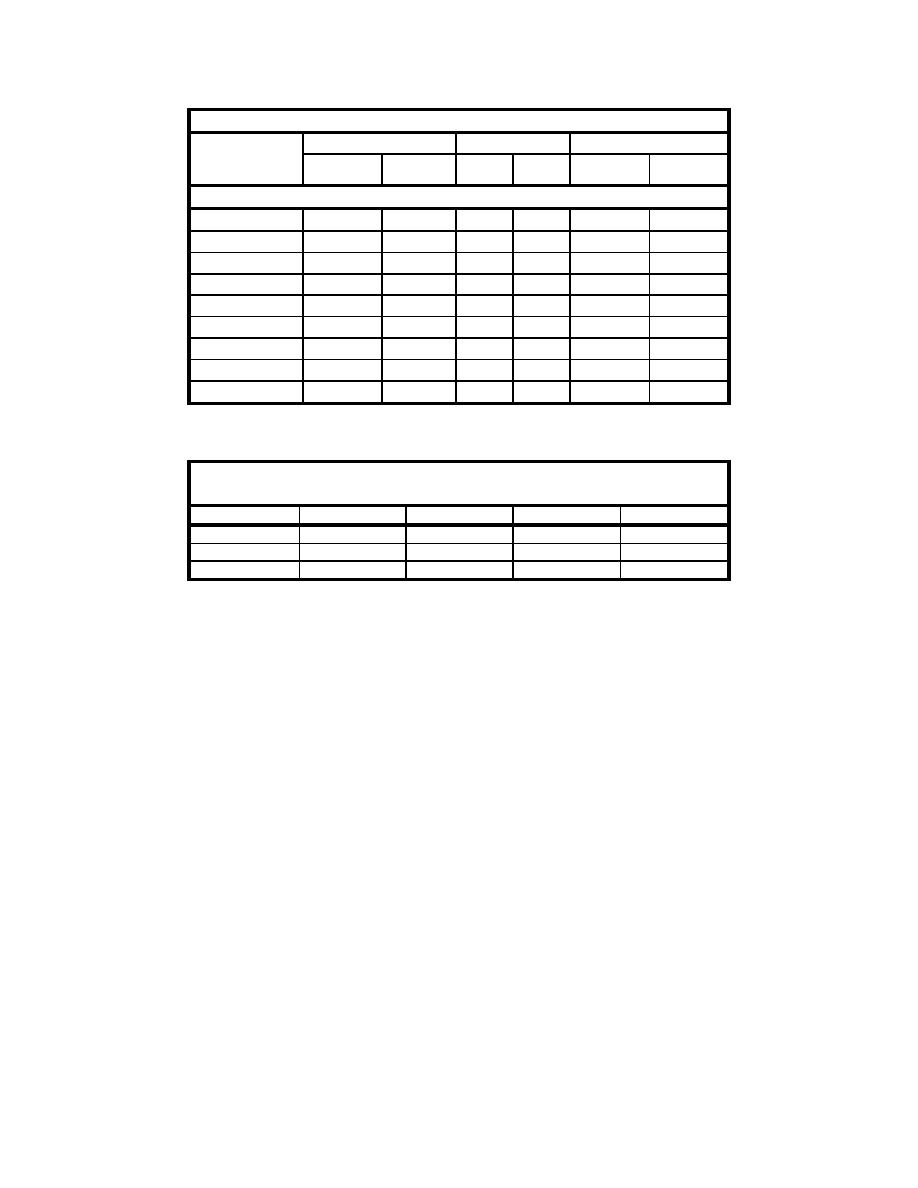 Table 1 (Concluded)
Bulk Sediment
Size Fractions
Density Fractions
<75 m >75 m
Composite
Composite
>2.0 sp.gr. <2.0 sp.gr.
Description
45
123
(Fines) (Sand)
(Mineral)
(Organic)
PAHs, g/kg (Concluded0
CHRYSE
192
247.7
152
850
66.2
992
BAANTHR
139
180.3
97.95
756
29.9
720
BBFLANT
127
173.3
112.5
565
53.4
762
BKFLANT
101
139.0
76.35
463.5
32.4
521
BAPYRE
149
193.3
108.45
769
35.6
747
I123PYR
122
164.3
99.45
540
39.4
637
DBAHANT
26.6
29.2
19.5
114
5.1
105
B-GHI-PY
149
179.3
112.5
614
48.3
678
2MeNAPH
130
157.7
98.95
426
31.8
574
Table 2
Particle Size Analysis of Green Bay Cell 5 Samples
Volume, %
Bulk 45
Bulk 123
Sand
Fines
< 5 m
27.1
24.3
5.88
30.5
< 75 m
93.3
90.8
43.5
99.98
> 75 m
6.70
9.2
56.5
0.02
removed. The procedure was repeated several times to ensure a reasonably clean
separation, as determined by visual inspection.
The four fractionated samples (fines, sand, mineral, organic) were analyzed
for PAHs, PCBs, metals, and indicator analytes. Density (mineral and organic)
samples were also analyzed for total volatile solids (TVS) to assess efficiency of
separation, but this parameter was ultimately not useful, being less than the
detection limit (DL) for both fractions. Results are summarized in Table 1.
The contaminant concentrations among the sand and fine fractions display
trends opposite of that expected. The sand fraction is typically assumed to be
relatively clean, and the fines to contain higher contaminant levels due to higher
surface area and clay chemistry. Here, however, PAH and PCB concentrations in
the sand exceed that of the fines, many by an order of magnitude. Most metal
manganese, molybdenum) were also higher in the sand than in the fines, but
within the same order of magnitude. During wet sieving, an oily film was noted
to settle on top of the sieved sand. It was thought that much of the contamination
could be associated with this film, or with a coarse organic fraction. To evaluate
this, the correlation coefficient was calculated for oil and grease and TOC
concentrations versus PAH, PCB and metal concentrations. The resulting values
indicate a strong linear relationship between oil and grease and PAH
11
Chapter 2 Project Description
|
|
Privacy Statement - Press Release - Copyright Information. - Contact Us - Support Integrated Publishing |
