 |
||
|
|
||
|
Page Title:
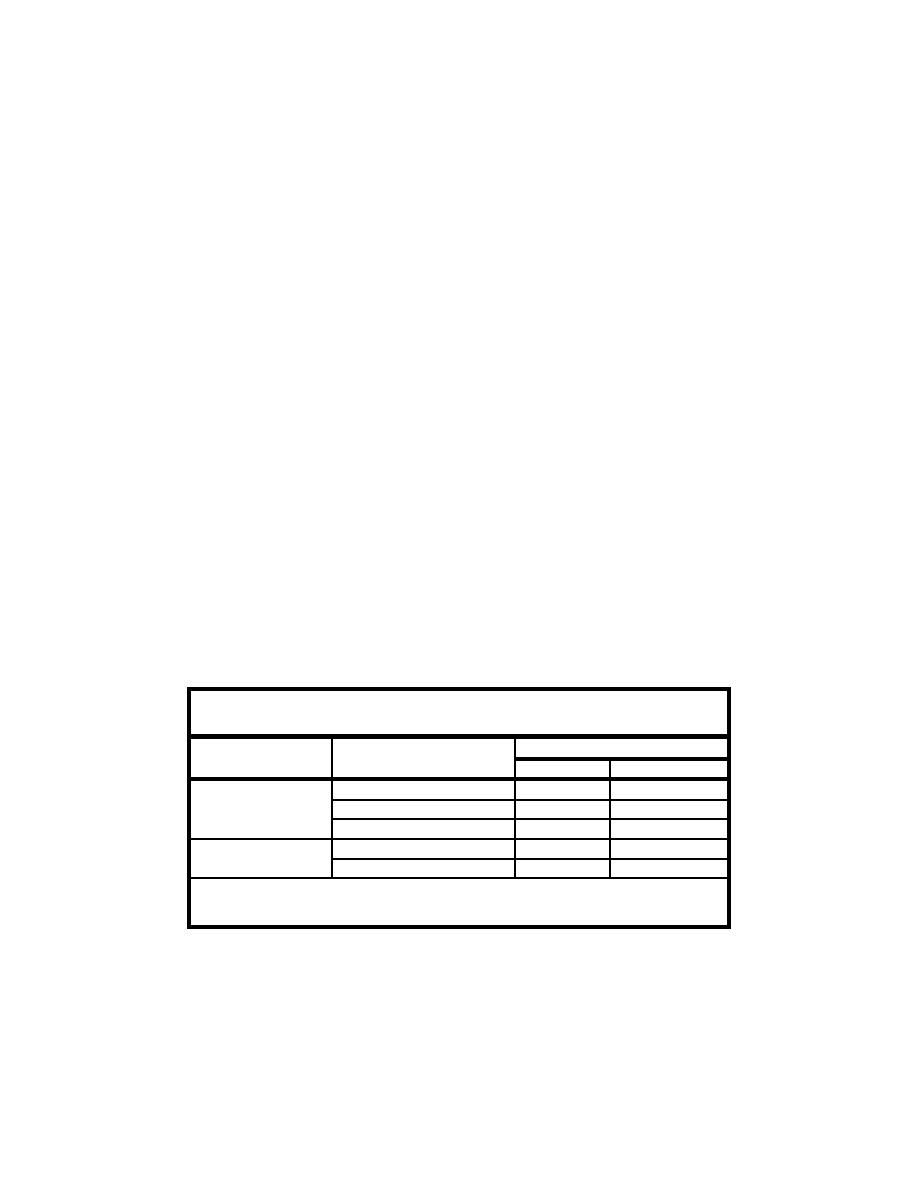
Table L-2. Suggested a Levels to Use for Tests of Assumptions |
||
| |||||||||||||||
|
|
 nonparametric tests, but careful laboratory practices can reduce the frequency of
outliers.
sample sizes (<50 observations total) is the Shapiro-Wilk's Test. This test
determines if residuals are normally distributed. Residuals are the differences
between individual observations and the treatment mean. Residuals, rather than
raw observations, are tested because subtracting the treatment mean removes any
differences among treatments. This scales the observations so that the mean of
residuals for each treatment and over all treatments is zero. The Shapiro-Wilk's
Test provides a test statistic W, which is compared to values of W expected from
a normal distribution. W will generally vary between 0.3 and 1.0, with lower
values indicating greater departure from normality. Because normality is
desired, one looks for a high value of W with an associated probability greater
than the prespecified a level.
Table L-2 provides a levels to determine whether departures from normality
are significant. Normality should be rejected when the probability associated
with W (or other normality test statistic) is less than a for the appropriate total
number of replicates (N) and design. A balanced design means that all
treatments have an equal (or nearly equal) number of replicate experimental
units. For applications in this Appendix, a design may be considered unbalanced
when the treatment with the largest number of replicates (nmax) has at least twice
as many replicates as the treatment with the fewest replicates (nmin). Note that
higher a levels are used when number of observations is small, or when the
design is unbalanced, because these are the cases in which departures from
normality have the greatest effects on t-tests and other parametric comparisons.
If data fail the test for normality, even after transformation, nonparametric tests
should be used (see Nonparametric Tests below).
Table L-2
Suggested a Levels to Use for Tests of Assumptions
a When Design Is
1
Test
Number of Observations
Unbalanced2
Balanced
0.10
0.25
N = 3 to 9
Normality
0.05
0.10
N = 10 to 19
0.01
0.05
N = 20 or more
0.10
0.25
n = 2 to 9
Equality of Variances
0.05
0.10
n = 10 or more
1
N = total number of observations (replicates) in all treatments combined; n = number of
observations (replicates) in an individual treatment.
2
nmax =? nmin.
2
Tables of quantiles of W can be found in Shapiro and Wilk (1965), Gill
(1978), Conover (1980), USEPA (1989) and other statistical texts. These
references also provide methods of calculating W, although the calculations can
be tedious. For that reason, computer programs are preferred for the calculation
L11
Appendix L
Statistical Methods
|
|
Privacy Statement - Press Release - Copyright Information. - Contact Us - Support Integrated Publishing |
