 |
||
|
|
||
|
Page Title:
Table L-8. Tests of Assumptions and Nonparametric Hypothesis Tests on Bioaccumulation Example Data Converted to Rankits and R... |
||
| |||||||||||||||
|
|
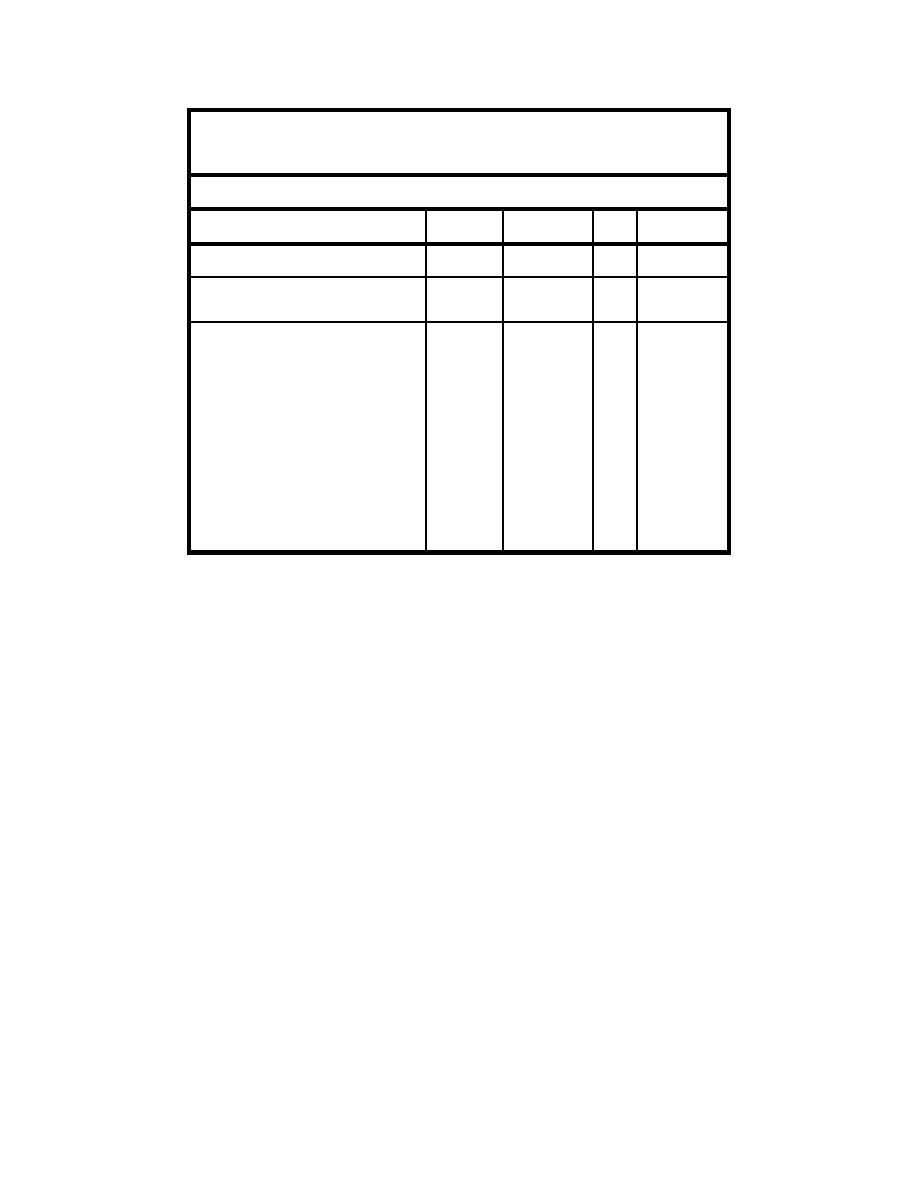 Table L-8
Tests of Assumptions and Nonparametric Hypothesis Tests on
Bioaccumulation Example Data Converted to Rankits and Ranks
Null Hypothesis: Median Dredged Material Bioaccumulation
Equals Median Reference Bioaccumulation
Test
Test
Statistic
a
Conclusion
P
Normality Assumption:
0.791
0.01
Do not reject
W = 0.972
Shapiro-Wilk's Test (rankits)
Equality of Variances Assumption:
0.621
0.10
Do not reject
F = 0.61
Levene's Test (rankits)
0.236
0.10
Do not reject
(ranks)
F = 1.57
Null Hypotheses:
Sediment 1 = Reference
t = 3.87
LSD Test (rankits)
0.0024
0.05
Reject
t = 4.69
t-Test (rankits, unequal variances)
0.0011
0.05
Reject
t = 4.14
Conover T-Test
0.0016
0.05
Reject
t = 6.18
t-Test (ranks, unequal variances)
0.0003
0.05
Reject
Sediment 2 = Reference
t = 3.32
0.0053
0.05
Reject
LSD Test (rankits)
t = 3.76
0.0040
0.05
Reject
t-Test (rankits, unequal variances)
0.0038
0.05
Reject
t = 3.54
Conover T-Test
0.0046
0.05
Reject
t = 3.95
t-Test (ranks, unequal variances)
Sediment 3 = Reference
0.0677
0.05
Do not reject
t = 1.66
LSD Test (rankits)
0.0706
0.05
Do not reject
t = 1.69
t-Test (rankits, unequal variances)
0.0497
0.05
Reject
t = 1.86
Conover T-Test
0.1215
0.05
Do not reject
t = 1.85
t-Test (ranks, unequal variances)
Because the example data passed both tests of assumptions, the LSD (6) was
conducted on the untransformed data to compare bioaccumulation from each
dredged sediment with bioaccumulation from the reference. LSD results
indicated that mean tissue levels for organisms exposed to dredged sediments 1
and 2 (but not 3) were significantly greater than mean tissue levels for organisms
exposed to the reference (Table L-7).
For the sake of illustration, Table L-7 also includes results for log-
transformed example data and for t-tests. Table L-8 gives nonparametric test
results for the example data. Note that the different statistical tests give
conflicting hypothesis test conclusions for the sediment 3 - reference
comparison, because the P-values of the tests are close to a . This situation will
often arise in the analysis of actual bioaccumulation data. Once again, it is not
acceptable to conduct several different statistical tests in order to choose the
results one prefers. For dredged material evaluations, the decision trees in this
Appendix should be followed to determine the appropriate statistical procedures
in any given situation. In the case of the example data, the tests of assumptions
indicate that the appropriate hypothesis testing procedure is the LSD test using
untransformed data, and the results of this test should be accepted. However, in
making decisions concerning placement, it is entirely appropriate to consider that
the significance of the treatment 3 - reference comparison is marginal. The
power of the LSD test (calculated below) should also be taken into consider-
ation.
L32
Appendix L
Statistical Methods
|
|
Privacy Statement - Press Release - Copyright Information. - Contact Us - Support Integrated Publishing |
