 |
||
|
|
||
|
Page Title:
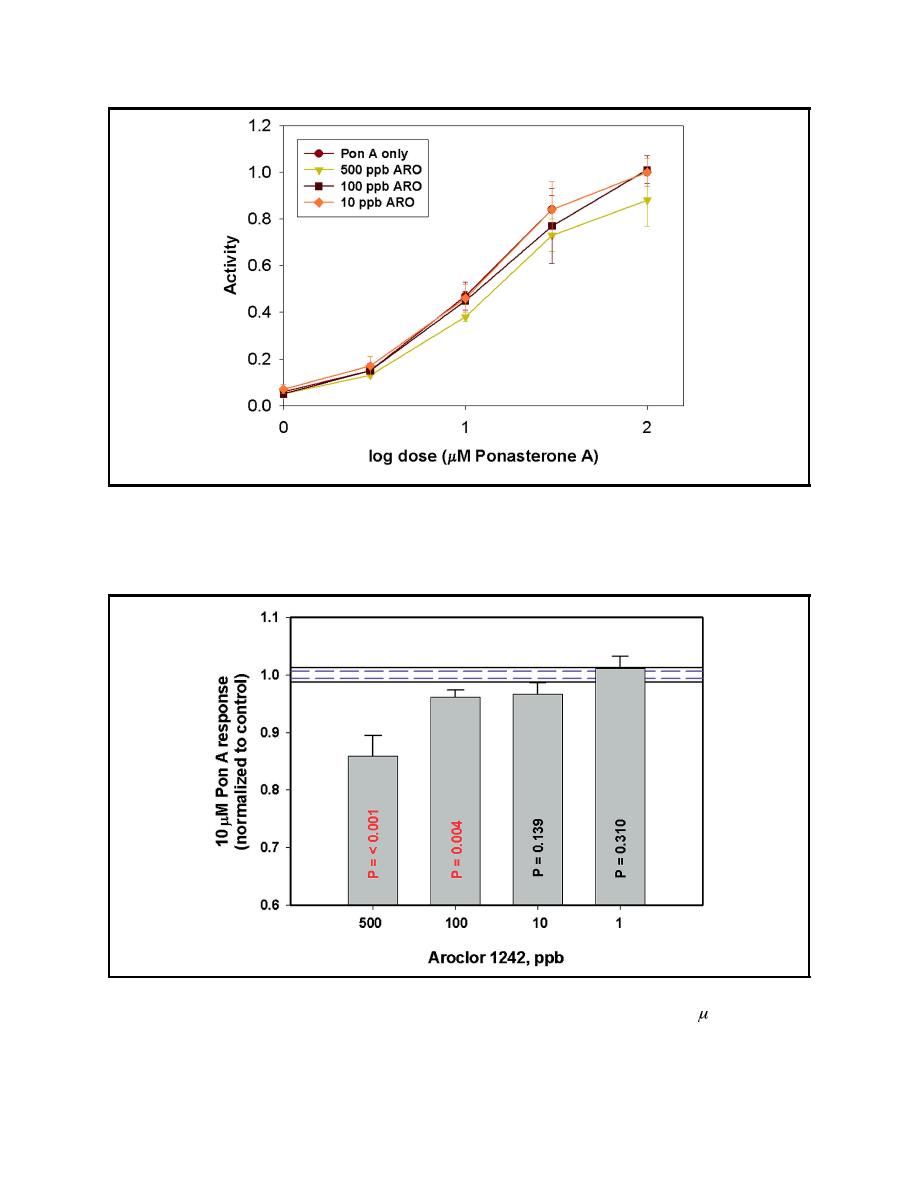
Figure 2. HepG2-EcR cell line dose-response. Data from co-exposure with Ponasterone A and A1242 |
||
| |||||||||||||||
|
|
 ERDC TN-DOER-C30
February 2003
Figure 2. HepG2-EcR cell line dose-response. Data from co-exposure with Ponasterone A and A1242.
Activity (mOD/min) in Aroclor treatments is normalized to the maximal induction of
Ponasterone A alone to allow comparison between experiments. Error bars represent
standard deviation of the measurements for the five experiments used to generate the data
Figure 3. Effect of co-administration of A1242 on 10-mM Ponasterone A response of HepG2-EcR cells.
Data from five exposures, each normalized to their respective responses to 10- M
Ponasterone A alone. Horizontal lines are Ponasterone A alone 95 percent confidence limits,
dashed lines are Ponasterone A alone standard error, and error bars are standard error.
Treatments are significant or not significant at the probabilities indicated
6
|
|
Privacy Statement - Press Release - Copyright Information. - Contact Us - Support Integrated Publishing |
