 |
||
|
|
||
|
Page Title:
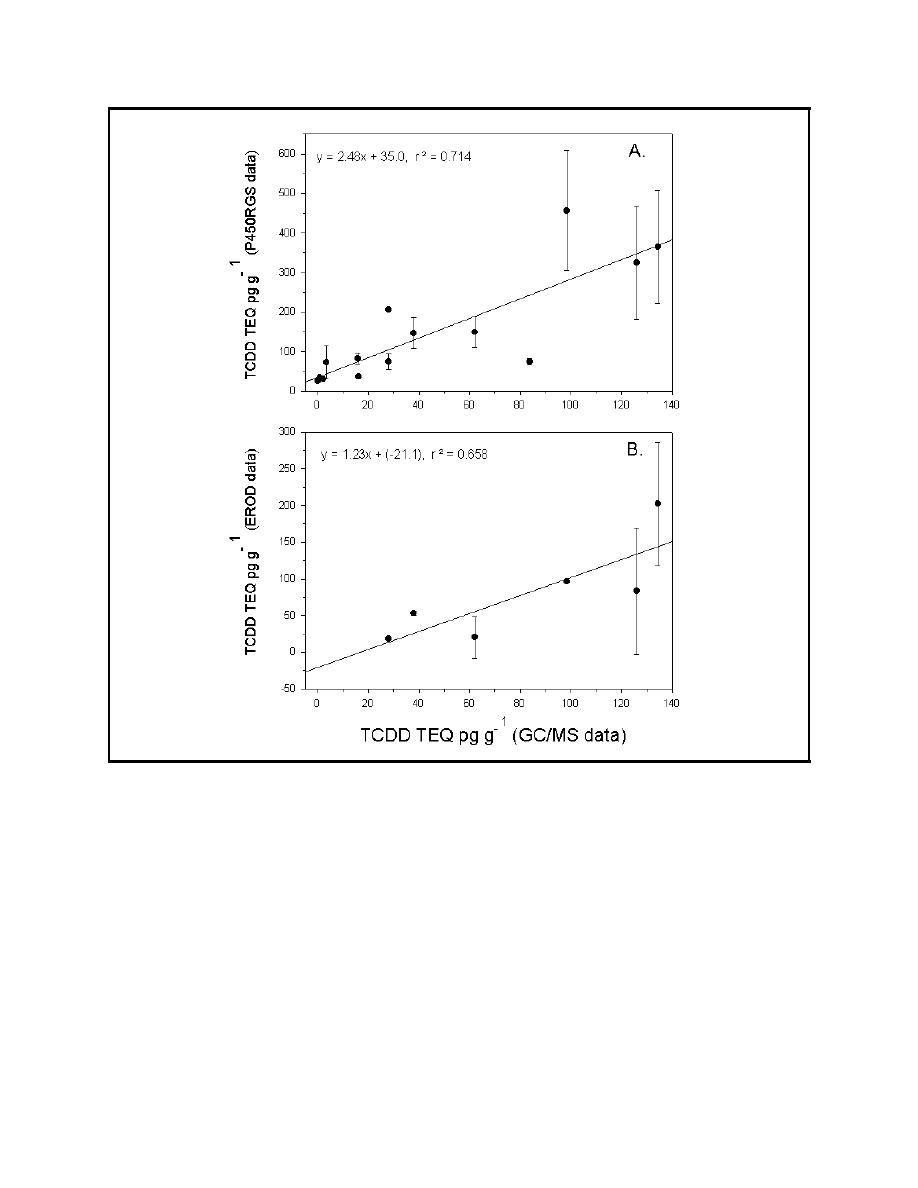
Figure 5. Correlation of calculated TCDD TEQs for GC/MS data with measured TCDD TEQs using the P450RGS assay |
||
| |||||||||||||||
|
|
 Technical Note DOER-C8
July 1999
Figure 5. Correlation of calculated TCDD TEQs for GC/MS data with measured TCDD TEQs using the
P450RGS assay (A) or the EROD assay (B) on 15 SA/SG-cleaned miscellaneous sediment
extracts (Means of six replicates SD)
the GC/MS data was 0.658 (Figure 5B). Comparison of the six sediment extracts with detectable
activity by both assays gave a correlation of 0.457 (Figure 6). As with the NYDMMP sediments,
the P450RGS assay gave a higher response (about 2-fold) than did the EROD assay.
Interlaboratory Comparison of the P450RGS Assay. Splits of the NYDMMP sediment
extracts were also analyzed by CAS in order to compare the reproducibility of results using the
P450RGS assay. CAS performed the assay using only three replicates of each sample, whereas six
replicates were analyzed at the U.S. Army Research and Development Center, Waterways Experi-
ment Station (WES). The interlaboratory comparisons are shown in Figures 7 and 8 (crude and
cleaned extracts, respectively). The correlation coefficients show that the results obtained by the
two laboratories were very similar.
8
|
|
Privacy Statement - Press Release - Copyright Information. - Contact Us - Support Integrated Publishing |
