 |
||
|
|
||
|
Page Title:
Table 3. Physical Properties of Dump Scow Sediment Samples |
||
| |||||||||||||||
|
|
 ERDC TN-DOER-D2
September 2004
Dump Scow Samples. Three 5-gallon bucket samples were collected from different locations
within a full barge of material dredged from a separate location in the Boston Harbor. A grab
sample was taken from the surface material in the barge, and two clamshell bucket samples were
obtained from within the barge material (SAIC 2000). The samples were analyzed and their
physical properties are shown in Table 3. Figures 4 and 5 show the grain size distributions, and
Table 4 shows the median and mean grain sizes.
Table 3
Physical Properties of Dump Scow Sediment Samples
Sample
Gs
LL
PL
PI
% sand
% silt
% clay
Class
Scow 1
2.33
77
37
40
11
57
32
MH
Scow 2
2.63
56
24
32
26
46
28
CH
Scow 3
2.63
40
35
5
43
36
21
ML
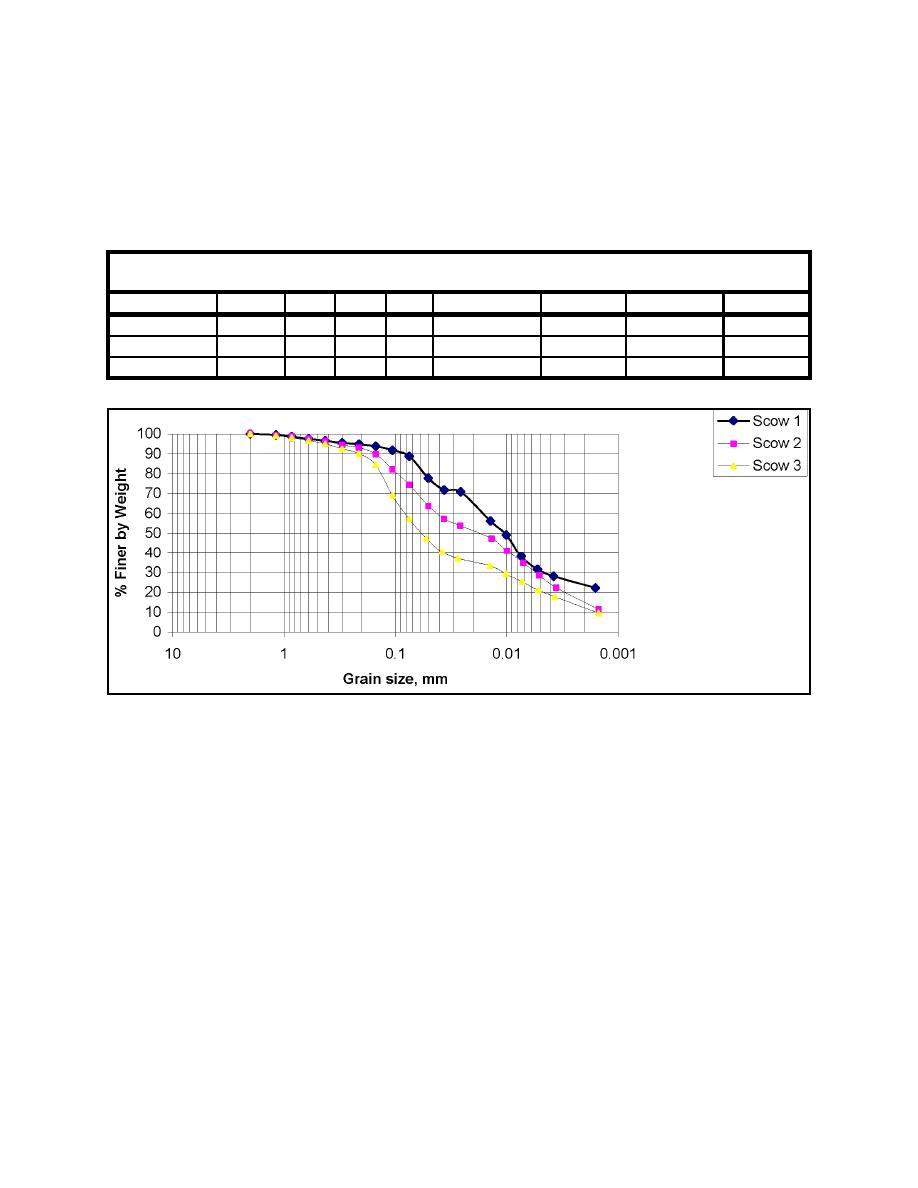
Figure 4.
Cumulative grain size distribution (by weight) curves for dredged material samples taken from
three points in the dump scow during one load cycle
Each sample taken from different locations within a single dump scow load has a progressively
larger median grain size, mean grain size, and sand percentage. The liquid limits, plasticity indi-
ces, and fine grain percentage progressively decrease. Each sample also has a different soil
classification. All three samples are fine-grained and visually appear to be identical.
Variability in physical properties such as Atterberg limits and grain size distribution has an
impact on the engineering behavior of the dredged materials. Figure 6, based on the liquidity
index (water content percent minus PL divided by PI), indicates that the material with the lowest
liquid limit and highest sand content (Scow 3) has a slightly higher shear strength at water
contents above its liquid limit than the other two materials. For example, if the end use of the
dredged materials was to build an upland dike, the materials represented by the Scow 3 sample
probably would exhibit higher slope stability (and factor of safety) at initial water contents above
the liquid limit than the other two materials. It is also possible that a higher rate of strength gain
with time (due to drying) would be observed in a Scow 3 dike if all three materials were initially
deposited wetter than their respective liquid limits, although additional testing would be required
to validate these engineering behavior assumptions prior to designing with the Scow 3 material.
5
|
|
Privacy Statement - Press Release - Copyright Information. - Contact Us - Support Integrated Publishing |
