 |
||
|
|
||
|
Page Title:
Table 6. Physical Properties of Ocean-Placed Sediment Samples |
||
| |||||||||||||||
|
|
 ERDC TN-DOER-D2
September 2004
Table 6
Physical Properties of Ocean-Placed Sediment Samples
Sample
Gs
LL
PL
PI
% sand
% silt
% clay
Class
Pre-
2.73
156
3
27
70
CH
Post-
2.65
69
26
43
27
37
36
CH
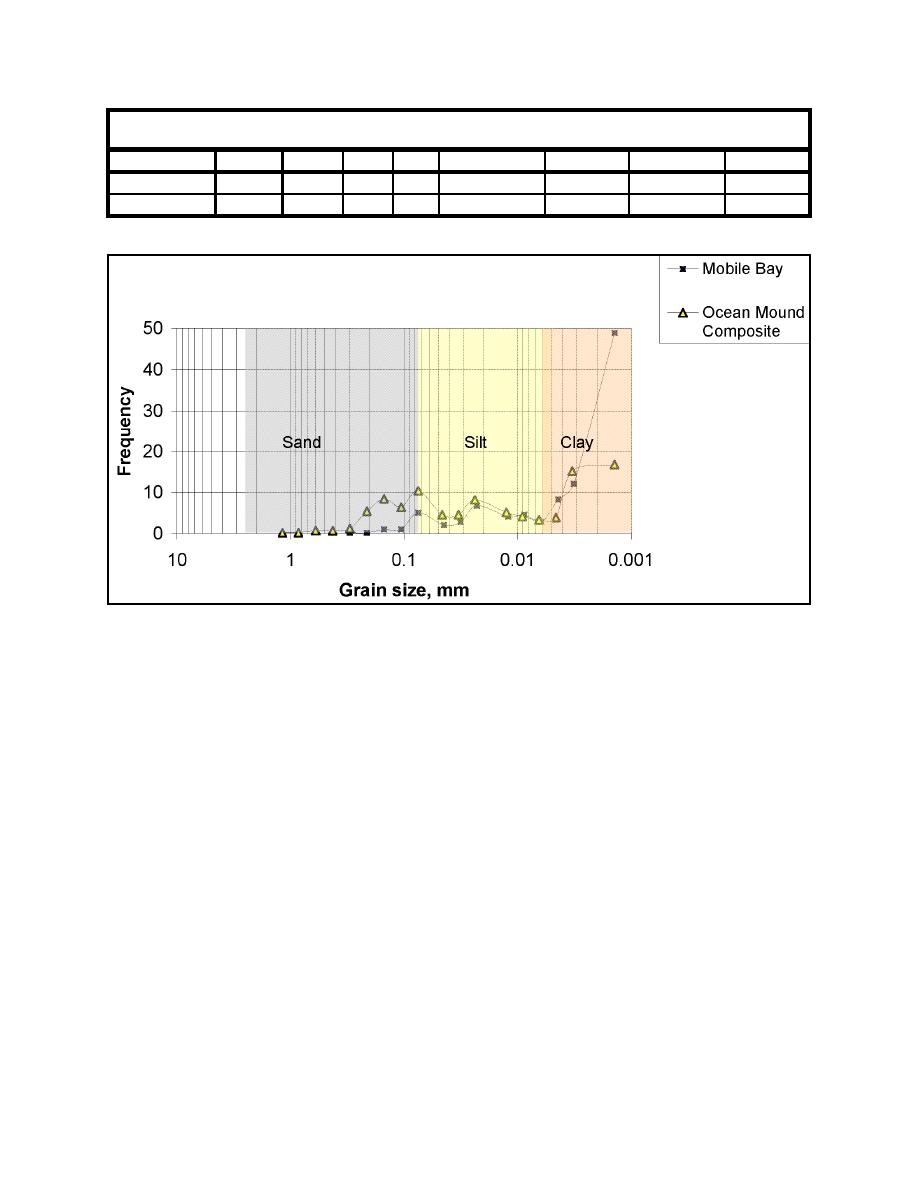
Figure 10. Frequency grain size distribution (by weight) curves for pre-dredged and post-placed material
samples
The two curves have similar particle size frequency distributions in the coarse sand and fine silt
ranges, but vary in the fine sand and fine clay ranges. The variation in the fine sand percentage is
likely due to mixing with the native sandy sediment, which has a mean size of 0.21 mm as
reported by Davis et al. (1999). The variation in the fine clay percentage is likely due to loss in
the water column during placement, or from surficial erosion as reported by Gailani et al. (2001).
Confined Aquatic Placement. Property variability has also been observed in pre-dredged
and post-placed sediments placed in a contained subaqueous pit. For the previously referenced
Boston Harbor project, the subaqueous cell M2 received material from the Mystic River channel
mechanically dredged in the relative vicinity of surficial grab samples MRA, MRB, and MRC.
The dredged material was placed using split-hull scows dumping through approximately 25 ft
(8.2 m) of water to the top of the subaqueous cell surface. Figures 11 and 12 compare composite
samples MRA, MRB, and MRC to the dredged material subsequently placed in subaqueous cell
M2.
10
|
|
Privacy Statement - Press Release - Copyright Information. - Contact Us - Support Integrated Publishing |