 |
||
|
|
||
|
Page Title:
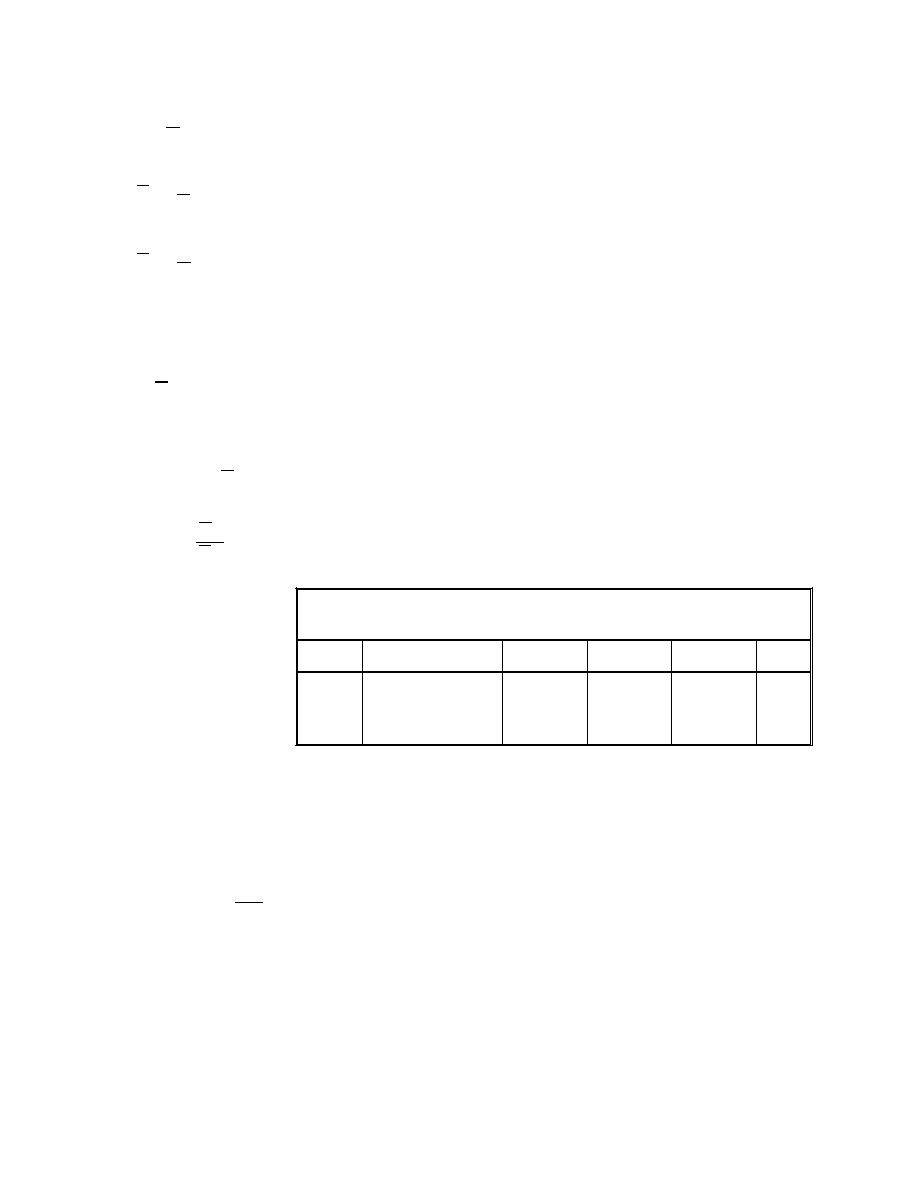
Table 1. Typical values of coefficients |
||
| |||||||||||||||
|
|
 ERDC TN-DOER-E10
April 2000
1
∑ ai Ci
a=
(11)
C i
1
∑ Culi Ci
Cul =
(12)
C i
1
∑ Clli Ci
Cll =
(13)
C i
and Culi and Clli are the nominal upper and lower concentration limits, respectively, for enhanced
settling of grain class i.
If C ≥ CuR then
Wsi = a
(14)
whereas, if C ≤ CRR then
FG Cll IJ n
i
H Cul K
Wsi = a
(15)
Table 1
Typical
values
of
Typical values of coefficients
Clli , Culi , ai, and ni for
four size classes are
Clli , g/cc
Culi , g/cc
Class
Size, microns
ai, m/s
ni
given in Table 1.
0
0-7 (clay)
50
1000
0.0001
1.33
1
8-35 (fine silt)
150
3000
0.0002
1.10
The next step in the set-
2
36-74 (coarse silt)
250
5000
0.0005
0.90
3
75-130 (fine sand)
400
8000
0.010
0.80
tling computations is to
compute a bottom shear
then computed for each size class as follows:
a. For size class 0 (clay), the following are used:
FG
IJ , if τ < τcd
τ
H
τcd K
P0 = 1 -
(16)
P0 = 0 , if τ > τcd
(17)
where τcd is the critical shear stress for deposition for the clay fraction.
7
|
|
Privacy Statement - Press Release - Copyright Information. - Contact Us - Support Integrated Publishing |
