 |
||
|
|
||
|
Page Title:
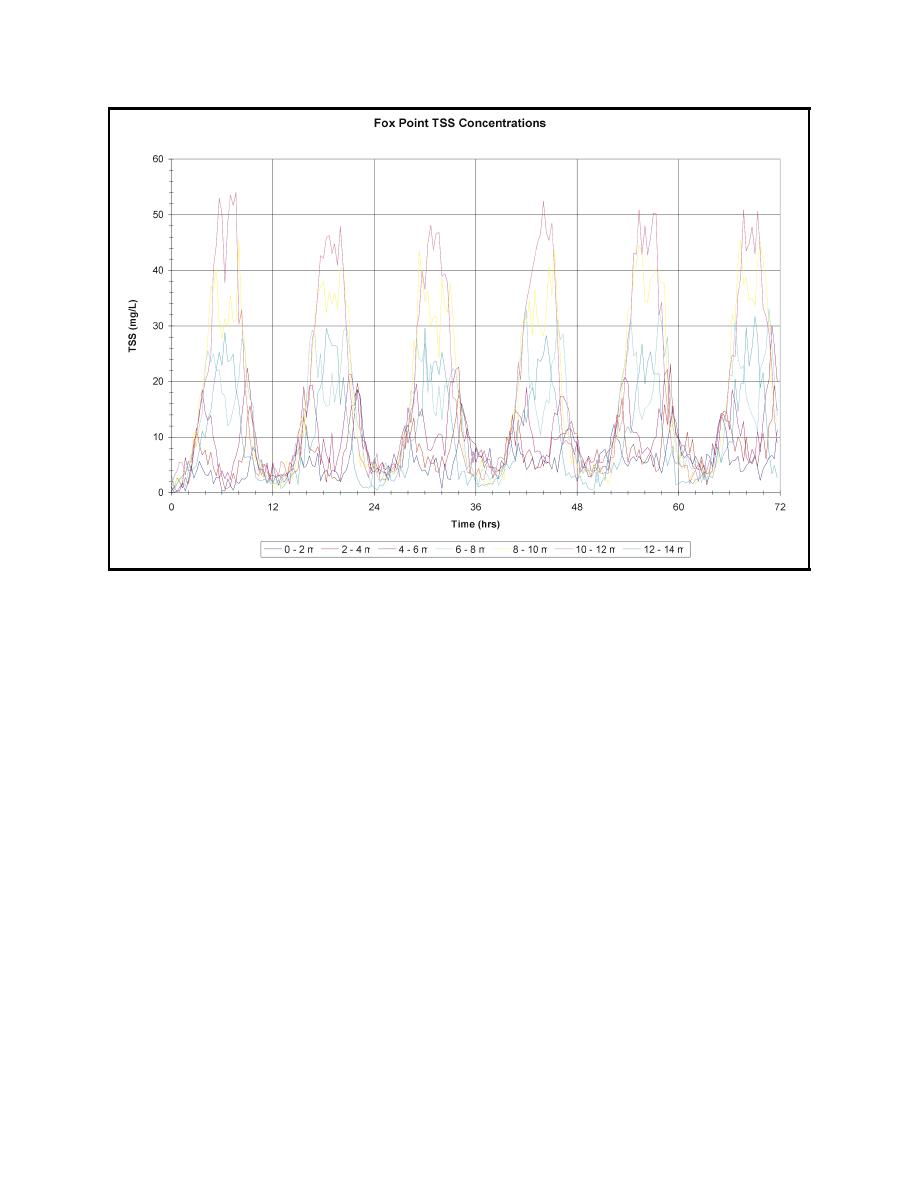
Figure 5. Time history of TSS concentrations over the water column with bucket release rate of 1.5 percent at the Fox Point R... |
||
| |||||||||||||||
|
|
 ERDC TN-DOER-E12
July 2000
Figure 5. Time history of TSS concentrations over the water column with bucket release rate of 1.5 per-
cent at the Fox Point Reach Central (FPRC) site. Concentrations are shown for each 2-m
layer thickness from surface to bottom
The time invariant maximum extent of the plume can be displayed by showing the maximum predicted
concentrations for the entire 72-hr simulation time. This extent of the plume will never actually be seen
in the river because it is a composite of approximately six tidal cycles. In actuality, during ebb tide the
plume will be located south of the site, while during flood the plume will be north of the site. Figure 6
shows both plan views of maximum concentrations computed during the simulation located at a depth
of 10-12 m (33-39 ft) and vertical section views for a release at the FPRC site for the three release rates.
It is evident that the plume extends over the entire water column, both up and down the channel from the
dredging site, at some time during the simulation. The plume axis is seen to follow the channel axis since
the ambient currents are aligned with the axis. The section view is defined by the dashed line in the plan
view. The maximum concentration (150 mg/L at the 4 percent release rate) is seen to occur near the
bottom at a depth of 10-12 m (33-39 ft). The increase in concentration as the release rate increases is
approximately proportional to the rate itself, at least near the dredging site.
Figure 7 shows the time history of the water column maximum TSS concentrations at the FPRC
site with a bucket release rate of 1.5 percent, along with similar concentrations at locations of 150 m
(500 ft) and 300 m (1,000 ft) up and down the channel from the site. As expected, the highest
concentration (peaking at 54 mg/L) occurs at the dredging site. The next highest concentration is
22 mg/L and occurs 150 m (500 ft) up channel from the site. At 300 m (1,000 ft) up channel, 150 m
(500 ft) down channel, and 300 m (1,000 ft) down channel of the site, maximum concentrations
range from 12 to 16 mg/L. It can be seen that the maximum concentrations drop to relatively low
9
|
|
Privacy Statement - Press Release - Copyright Information. - Contact Us - Support Integrated Publishing |
