 |
||
|
|
||
|
Page Title:
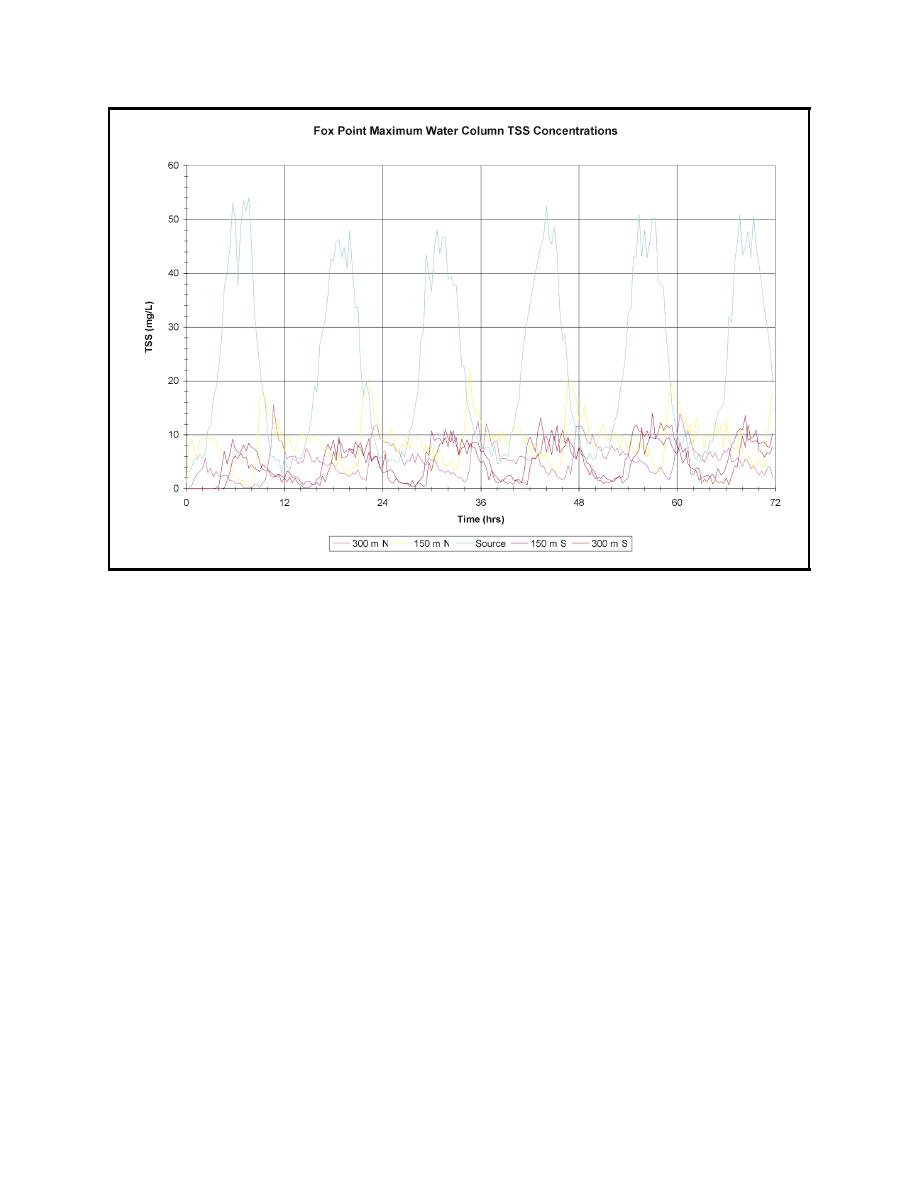
Figure 7. Time history of maximum water column TSS concentrations with bucket release rate of 1.5 percent at the Fox Point Re... |
||
| |||||||||||||||
|
|
 ERDC TN-DOER-E12
July 2000
Figure 7. Time history of maximum water column TSS concentrations with bucket release rate of
1.5 percent at the Fox Point Reach Central (FPRC) site. Also shown are TSS concentrations
150 m (500 ft) and 300 m (1,000 ft) up and down channel of the site
levels as the tide changes. Table 4 summarizes the maximum peak concentrations computed and
the depths where those concentrations occurred. Note that some channel depths away from the
source are greater than those at the source.
Figure 8 shows the time history of the vertical locations of the maximum concentrations shown in
Figure 7. Since the vertical model layer resolution is 2 m (6 ft), the locations are plotted as odd
numbered depths that correspond to the center of each layer. The depth of maximum concentration
at the dredging site varies from -13 m (43 ft) to -1 m (3 ft) in a cyclic pattern over the tidal cycle.
The vertical oscillation of maximum concentration is less for the sites further away from the source
location. Thus, at 300 m (1,000 ft) down channel of the site, the relatively small concentration
oscillations (0-10 mg/L) only vary from -1 m (3 ft) to -7 m (23 ft).
Figure 9 shows the time history of the water column maximum TSS concentrations at the FPRC
site with a bucket release rate of 2 percent, along with maximum concentrations at locations 150 m
(500 ft) and 300 m (1,000 ft) up and down the channel from the site. The highest concentrations
(peaking at 72 mg/L) occur at the dredging site. The next highest concentration is 30 mg/L and
occurs 150 m (500 ft) up channel. At 300 m (1,000 ft) up channel, 150 m (500 ft) down channel,
and 300 m (1,000 ft) down channel from the site, maximum concentrations range from 16 to
21 mg/L. Table 4 also lists the maximum peak concentrations and the depths where the concentra-
tions occurred for this simulation.
11
|
|
Privacy Statement - Press Release - Copyright Information. - Contact Us - Support Integrated Publishing |
