 |
||
|
|
||
|
Page Title:
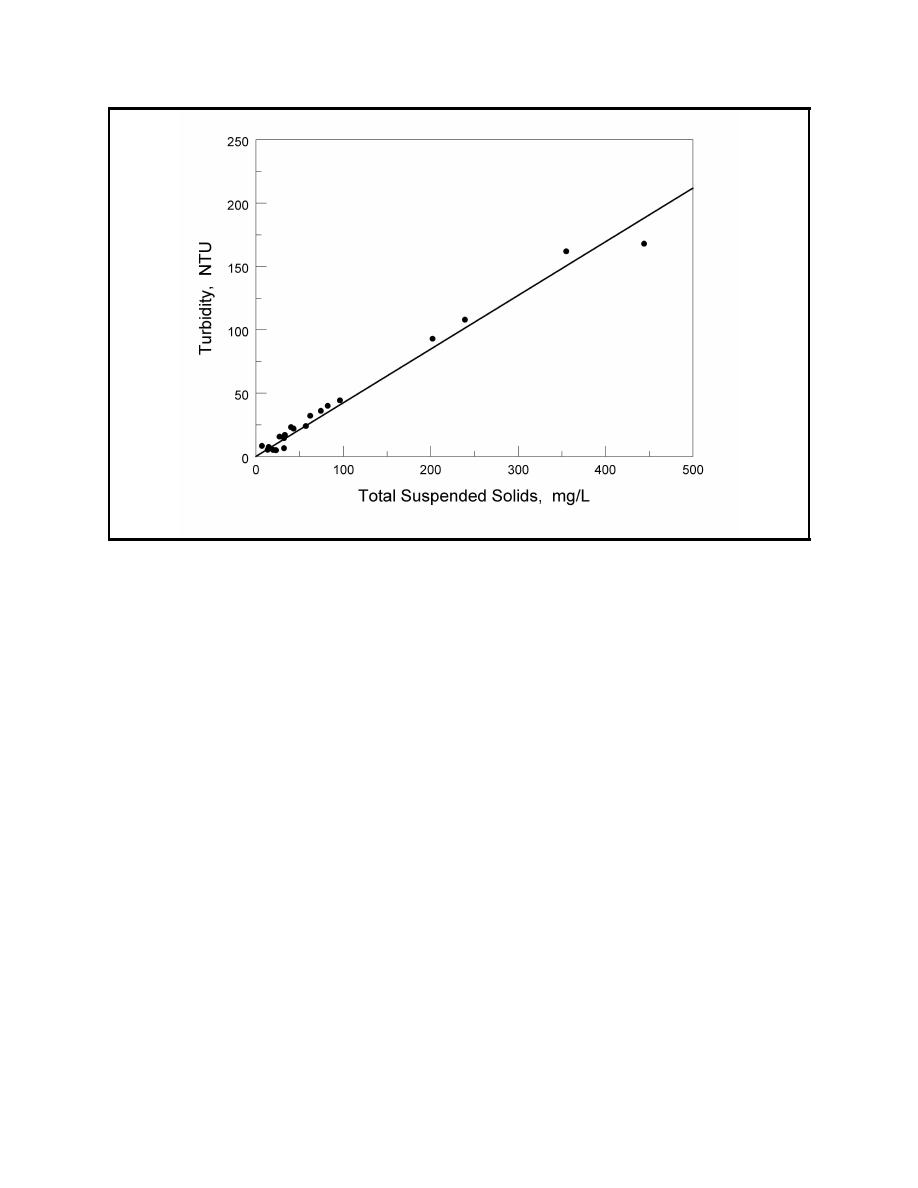
Figure 2. Laboratory column data showing relationship of turbidity and TSS for Middle Ground Island sediment |
||
| |||||||||||||||
|
|
 ERDC TN-DOER-E8
June 2000
Figure 2. Laboratory column data showing relationship of turbidity and TSS for Middle Ground Island
sediment
the correlation curve, where the upper bound of TSS data used is approximately the maximum TSS
that will be allowed in the discharge.
Another potential problem is the use of a laboratory curve derived from one location for a different
location. This should be strictly avoided. Even sediments from different reaches of the same
channel can have different physical characteristics and different turbidity-TSS correlation curves.
If the physical characteristics of the sediments change along a project, different laboratory correla-
tion curves should be derived and later field-adjusted.
This situation is illustrated in Figure 3, which shows laboratory correlation curves on sediments
from five locations in addition to Mobile Harbor. Even the three reaches of the Calcasieu River
produce different curves. For a turbidity of 50 NTU, the curve from reach 1 would predict a TSS
of 300 mg/L, that from reach 2 would predict a TSS of 250 mg/L, and that from reach 3 would
predict a TSS of 225 mg/L.
If these procedures and cautions are used, the use of turbidity as a surrogate for TSS can be a useful
aid to monitoring dredging projects. Because a relatively large number of samples can be checked
routinely and quickly, arbitrary and costly delays or shutdowns can be avoided.
CONCLUSIONS: Turbidity and suspended solids are common parameters of concern of regulat-
ing agencies and are often included in environmental monitoring plans for dredging operations,
open-water disposal, and confined disposal effluent discharges. Measurement of suspended solids
takes several hours and is impractical, when conditions change rapidly, for use as a control strategy.
9
|
|
Privacy Statement - Press Release - Copyright Information. - Contact Us - Support Integrated Publishing |