 |
||
|
|
||
|
Page Title:
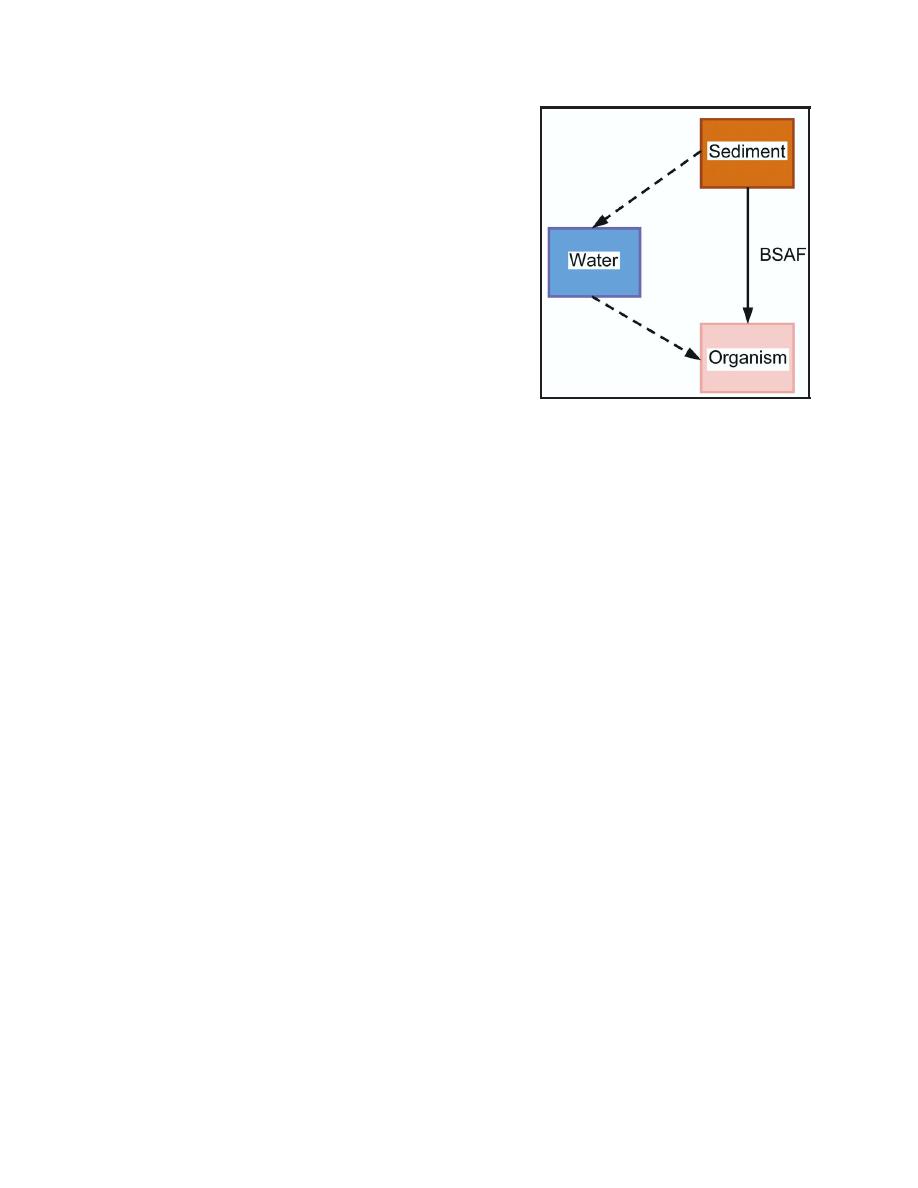
Figure 5. Schematic of TBP process |
||
| |||||||||||||||
|
|
 ERDC TN-DOER-R2
December 2001
The assumptions of the TBP model derive from thermody-
namics. The system, consisting of sediment, organism, and
water, is modeled as being closed. A neutral organic
chemical in the system is given free movement and will
distribute throughout the phases until equilibrium is estab-
lished. The concentrations at equilibrium are determined
by the chemical potentials in each phase. Organic carbon
in the sediment and lipids in the organism are assumed to
be the primary compartments that account for partitioning
of neutral chemicals. Thus, the expected equilibrium con-
centration in an exposed organism of a given lipid content
is a function of the concentration of a chemical in the
sediment (normalized on the basis of its organic carbon
content) and a partitioning coefficient between the sedi-
ment and the lipids (McFarland 1984; McFarland and Figure 5. Schematic of TBP process
Clarke 1987). The model equation is
TBP = BSAF (Cs / foc ) fL
(1)
where the partitioning coefficient is the BSAF and
Cs = concentration of neutral organic chemical in sediment
foc = decimal fraction total organic carbon content of the sediment
fL = decimal fraction lipid content of the target organism
TBP was incorporated into the RECOVERY model to assess the effect of contaminated sediments
on biota (Ruiz and Gerald 2001). The model uses the organic carbon foc of the sediments and the
estimated contaminant sediment concentration Cs to estimate the body burden of biota exposed to
contaminated sediments over a long period of time (years or decades). The user is encouraged to
use site-specific data to estimate BSAFs and biota lipid content. If site-specific data are not
available, the BSAF database has lipid and BSAFs for a number of contaminants.
BSAF. The BSAF database was constructed from numerous field and laboratory observations.
Empirically derived BSAFs were calculated as
BSAF = (Ct / fL ) / (Cs / foc )
(2)
where Ct / fL is the lipid-normalized contaminant concentration in the tissues of the exposed
organism and Cs / foc is the organic carbon-normalized contaminant concentration in the sediment
to which the organism has been exposed. The database contains BSAFs for contaminants of concern
and lipid fractions for a number of organisms.
DREDGE. DREDGE uses empirical and analytical models to estimate the resuspension and
transport of sediments and associated contaminants during dredging operations. DREDGE com-
bines empirical sediment resuspension (near-field) models and simple suspended sediment transport
6
|
|
Privacy Statement - Press Release - Copyright Information. - Contact Us - Support Integrated Publishing |
