 |
||
|
|
||
| |||||||||||||||
|
|
 Typical consolidation results
As in all consolidation analyses in geotechnical engineering, the profile
of the deposit (including thickness and extent of each material) must be de-
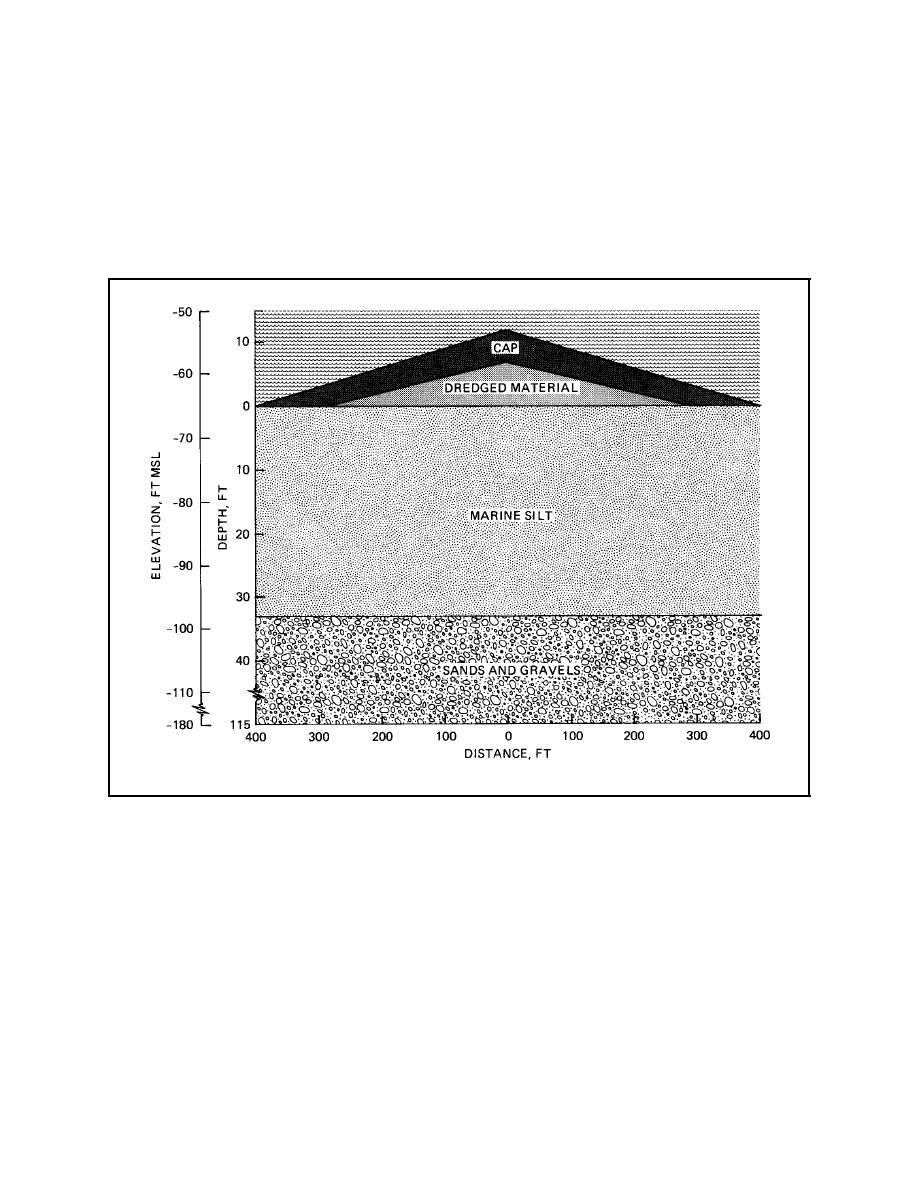
termined. An idealized mound geometry for an LBC project is shown in
Figure 22. The consolidation of the mound is then predicted using an ap-
propriate finite strain consolidation model, and the results should then be
plotted.
Figure 22.
Idealized soil profile of mound and foundation soils
Two types of plots are often used to show the amount of consolidation
that is expected to occur in a dredged material mound. The ultimate
change in elevation of the mound surface is often plotted to show the
change in configuration that can be expected following consolidation. Fig-
ure 23 shows the original and final mound height when consolidation only
(i.e., no erosion) is considered. Secondly, a plot is usually constructed of
settlement over time at a particular point or points in the mound. This
plot can show the individual quantities of consolidation settlement pre-
dicted for the capping material, the contaminated dredged material, and
the foundation soil; it will normally also show the total settlement ex-
pected. This type of plot is very useful for comparing predicted settle-
ment (or surface elevation) with field-monitoring data. Figure 24 shows
83
Chapter 8 Long-Term Cap Stability
|
|
Privacy Statement - Press Release - Copyright Information. - Contact Us - Support Integrated Publishing |