 |
||
|
|
||
|
Page Title:
Figure 29. Idealized mound cross sections showing maximum and average vertical erosion and areas over which erosion volume is... |
||
| |||||||||||||||
|
|
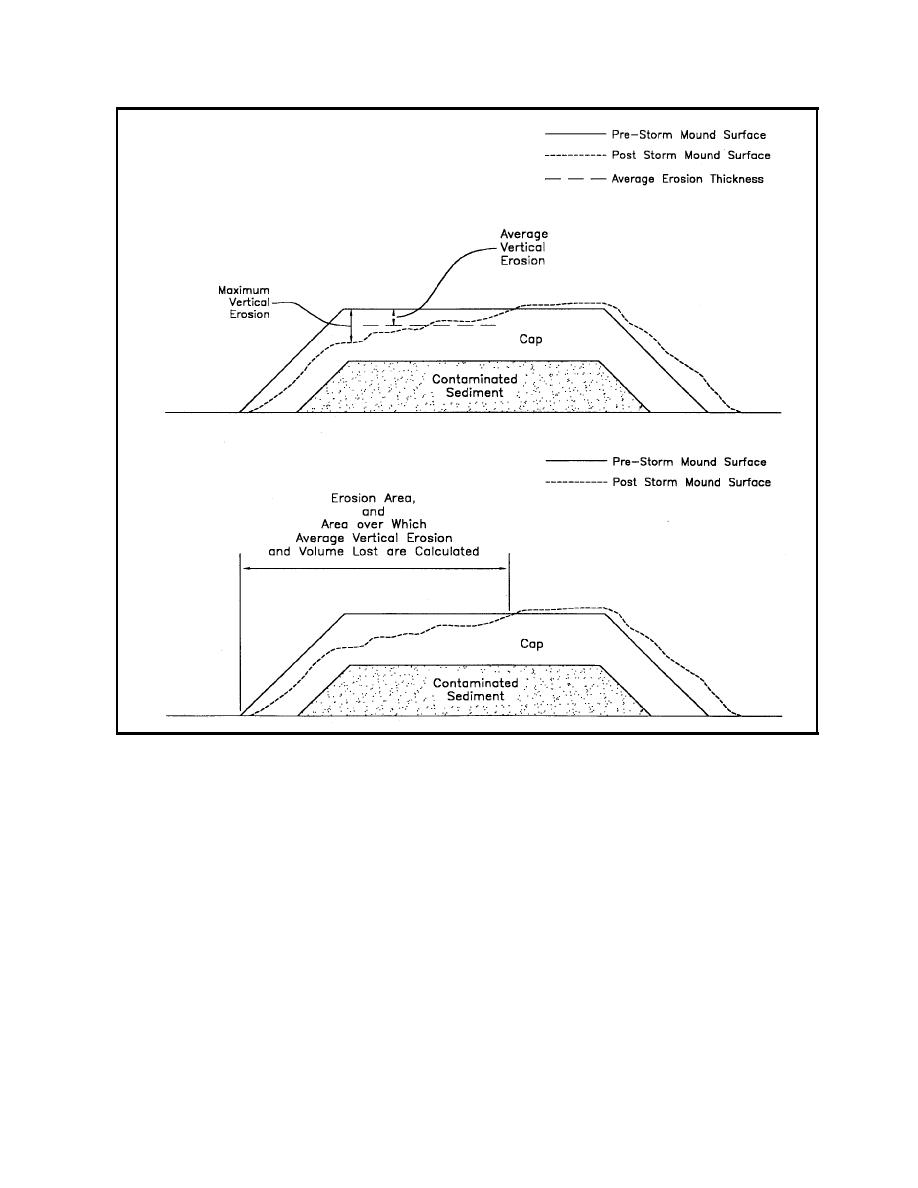 Figure 29.
Idealized mound cross sections showing maximum and average vertical erosion and ar-
eas over which erosion volume is computed
gaining approval to cap, and other factors including political/social issues.
Thicker erosion layers will reduce risk with a corresponding increase in
cost.
The decision on the appropriate erosion layer thickness then will be
site or region specific. For projects with minimally contaminated material
where additional projects are expected in the next few years, a relatively
short return period erosion thickness could be selected, say 10-20 years.
Note that in Table 6, the erosion thickness for the 75-ft mound crest is
0.7 ft at a 10-year return period while the 100-year return period thickness
in only 1.1 ft. For a mound at this depth, the designers may decide the
extra protection provided by the additional 0.4 ft of cap is a good invest-
ment. However, for the 50-ft mound crest, the difference between the
10-year erosion thickness and 100-year erosion thickness is 1.5 ft
(2.4 versus 3.9 ft), almost four times greater than at 75 ft. Therefore, if a
96
Chapter 8 Long-Term Cap Stability
|
|
Privacy Statement - Press Release - Copyright Information. - Contact Us - Support Integrated Publishing |
