 |
||
|
|
||
| |||||||||||||||
|
|
 Tidal Hydrograph Development
The surge hydrographs corresponding to the tropical and 1977-1993 extra-
tropical storm seasons were simulated over the domain shown in Figure G1;
however, simulations did not include tides at the time of the event, i.e., they were
modeled with respect to MSL. Because tide elevation and currents will be a
factor in mound erosion, they must be included. When tidal phase is accounted
for, each storm event has an equal probability of occurring at (a) high tide,
(b) MSL during peak flood, (c) low tide, and (d) MSL during peak ebb. These
four phases are designated as phases 0, 90, 180, and 270 degrees, respectively.
Obtaining the needed tidal elevation and current data can most effectively be
accomplished by using the DRP-generated 8-constituent (4 primary semidiurnal
and 4 diurnal) database of tidal constituents corresponding to each node shown
in Figure G1 (Westerink, Luettich, and Scheffner 1993). This effort also made
use of the ADCIRC program. A linear interpolation scheme (described in the
report) uses this database to provide tidal constituents at any location within the
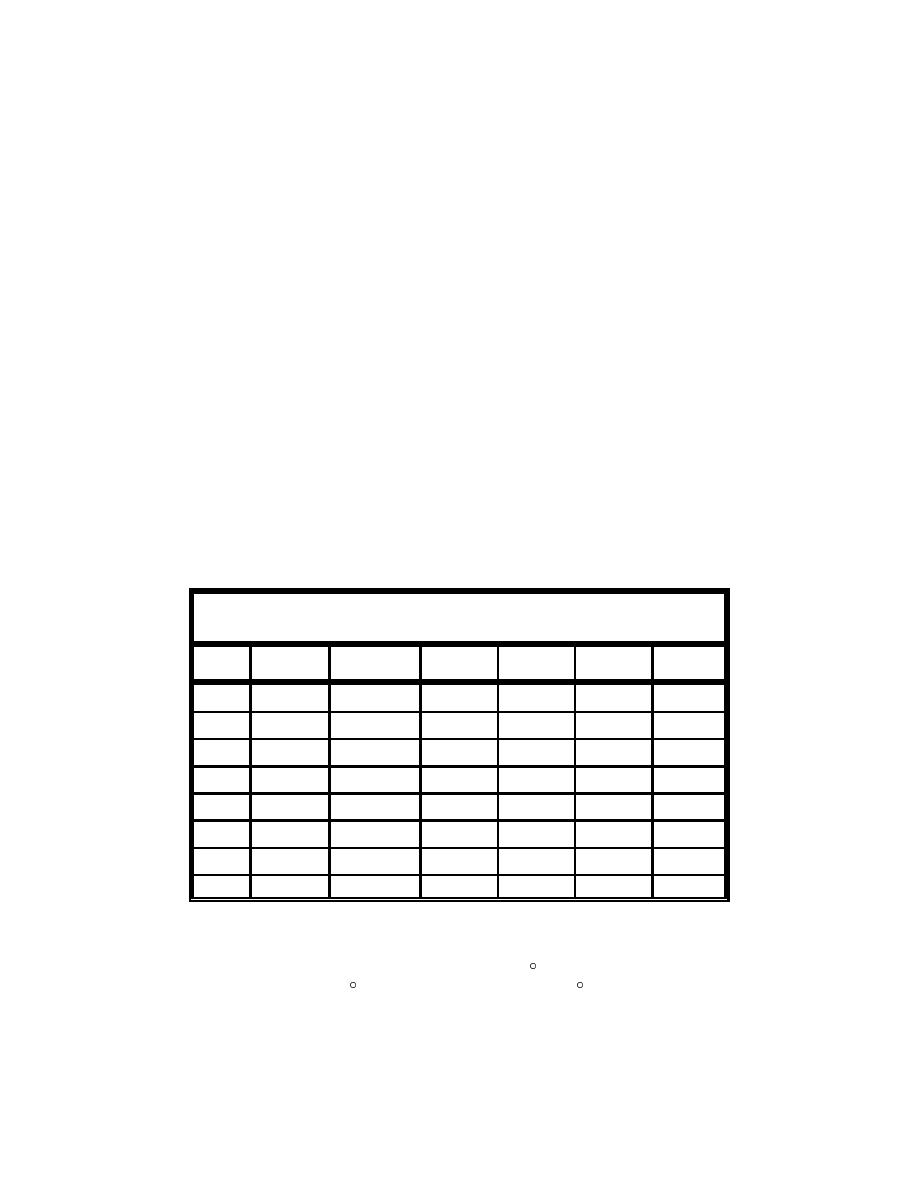
domain. At the Mud Dump site the M2 semidiurnal tidal constituent accounts for
over 90 percent of the tidal energy (based on the 8-constituent database) as can
be seen in the listing of constituent amplitude and local epochs k generated for
DRP-WIS Station 304 shown in Table G2. (Constituents were generated at
Station 304 instead of the Mud Dump site in order for the tide to correspond to
the hydrographs archived at Station 304).
Table G2
Tidal Constituents for DRP-WIS Station 304
U-amp,
V-amp,
Const
h-amp, m
h-k, deg
cm/sec
U-k, deg
cm/sec
V-k, deg
k1
0.0867
95.2
0.0049
194.3
0.0061
27.1
O1
0.0589
100.4
0.0028
193.3
0.0042
43.5
P1
0.0359
91.0
0.0020
193.5
0.0028
19.7
Q1
0.0111
98.3
0.0006
202.4
0.0007
19.2
N2
0.1704
195.6
0.0181
295.6
0.0226
116.0
M2
0.7744
215.3
0.0837
313.8
0.1012
133.8
S2
0.1507
254.6
0.0169
355.4
0.0213
173.4
K2
0.0482
246.6
0.0054
347.2
0.0068
164.9
To account for the four tidal phases, M2 amplitude A and local epoch
phase data k for elevation (h = 0.7744 m, k = 215.3 ) and current (U: A =
0.0837 m/sec, k = 313.8 ; V: A = 0.1012 m/sec, k = 133.8 ) were extracted from
the DRP database and used to expand the 16 tropical storms and 16 extratropical
season database of storms without tides to a 64 tropical storm database with tides
and a 64 extratropical season database with tides. This expanded set of
G13
Appendix G Procedures for Conducting Frequency-of-Erosion Studies
|
|
Privacy Statement - Press Release - Copyright Information. - Contact Us - Support Integrated Publishing |