 |
||
|
|
||
| |||||||||||||||
|
|
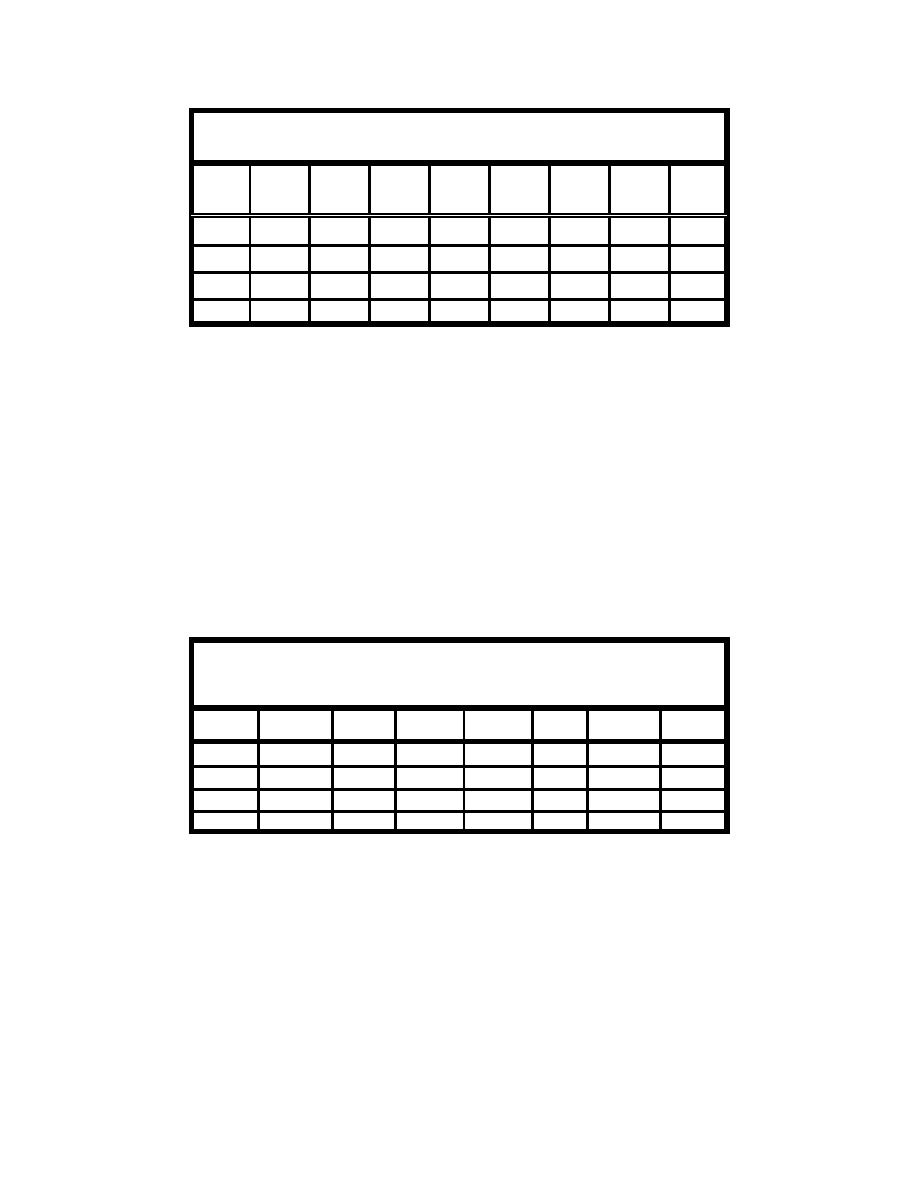 Table G6
Tropical Storm Input and Response Vectors for the Mud Dump Site
Tide
Min.
Track
Max.
Forw.
Hurr.
Phase
Dist.
Angle
Pres.
Vel.
Vel.
Rad.
Vert.
No.
0-1
miles
deg
Def., mb
knots
knots
Max. nm Eros., ft
296
1.0
84.85
29.35
25.83
30.68
18.39
43.42
0.20
327
1.0
172.3
10.41
35.31
45.00
20.19
43.42
0.20
748
1.0
17.45
13.46
32.19
67.53
21.81
8.68
0.10
835
1.0
11.32
20.59
56.97
82.04
37.89
36.93
0.80
Gulf coast in 1969, cannot occur in the Bight because historical records indicate
that storms of this magnitude have not impacted the Bight. This is probably due
to both the exposure of the Bight and the northerly latitude. The second assump-
tion is that the frequency of events is similar to historic activity. In the
New York Bight, the frequency used is 16 events per 104 years, i.e., frequency =
0.15385.
Extratropical storm vectors
Input and response vectors for the four events of the 1977-78 extratropical
storm season for the zero tidal phase for the site scenario of an 8-ft mound
located in 83 ft of water are shown in Table G7.
Table G7
Extratropical Storm Input and Response Vectors for Mud Dump
Site
Tidal
V-Max
Storm No. pH-deg
Dur, hr
Q-Max
H, m
T,sec
cm/s
E-Max, ft
1
0
21
68.9
5.9
12.0
51.8
0.20
2
0
21
57.6
5.6
12.0
50.8
0.20
3
0
18
50.4
5.6
10.0
51.8
0.20
4
0
15
35.3
4.7
12.0
49.5
0.10
In an identical procedure to the tropical storm simulations, the EST uses the
input and response vectors of Table G7 for the selected extratropical storm
events and for each of the four tidal phases as a basis for simulating multiple
repetitions of multiple years of storm activity. As mentioned above, the EST
assumes that future storm activity will be similar to past events. In the
New York Bight, the frequency used is 38 events per 16 years, i.e., frequency =
2.375 storms/year.
The EST program generates a 200-year tabulation consisting of the number of
storm events that occurred each year and the vertical erosion corresponding to
G22
Appendix G Procedures for Conducting Frequency-of-Erosion Studies
|
|
Privacy Statement - Press Release - Copyright Information. - Contact Us - Support Integrated Publishing |
