 |
||
|
|
||
|
Page Title:
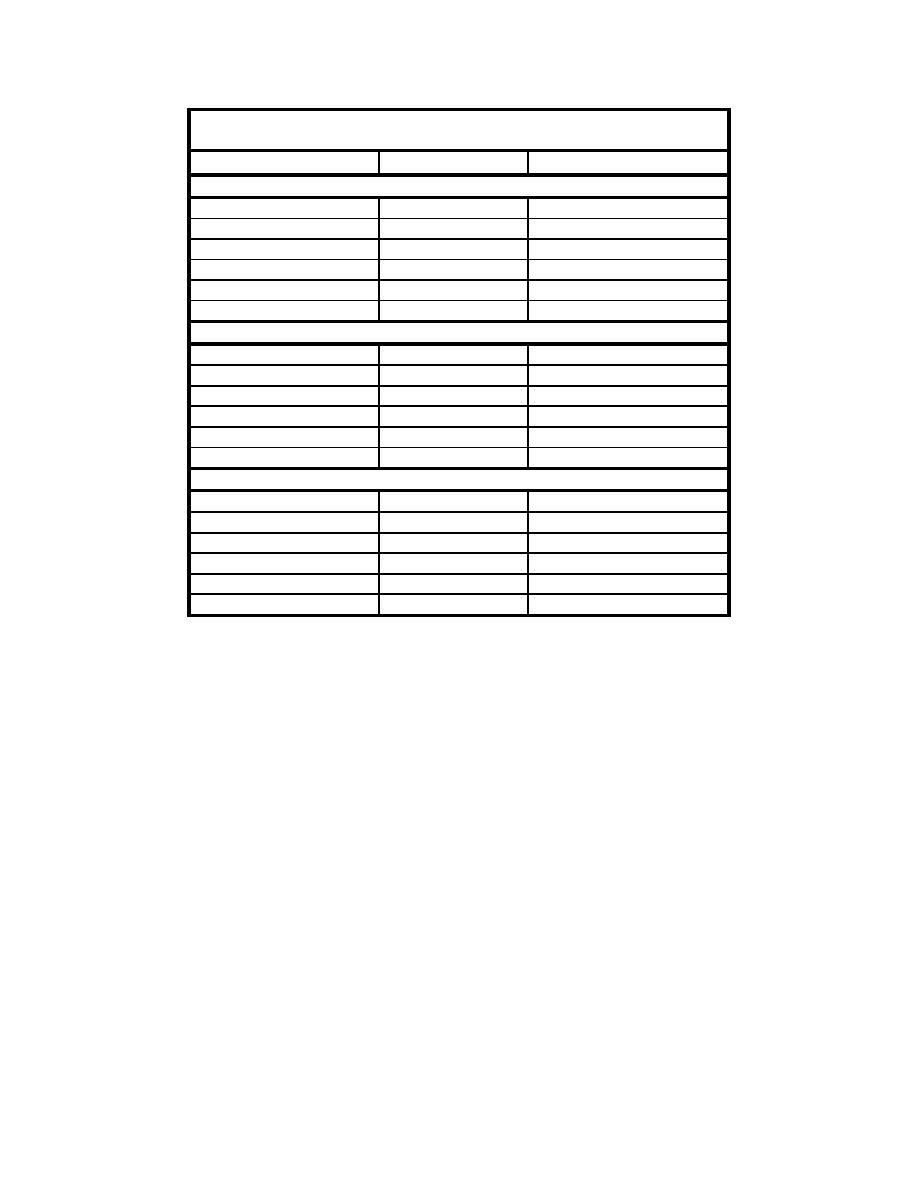
Table 6. Percent Moisture and Percent Solids of Process Streams |
||
| |||||||||||||||
|
|
 Table 6
Percent Moisture and Percent Solids of Process Streams
Sample
Percent Moisture
Percent Solids
Feed
F1400
94.08
5.92
F1505
98.53
1.47
F1525
98.18
1.82
F1625
98.53
1.47
F1715
98.19
1.81
Average
97.5
2.5
Overflow
O1400
96.94
3.06
O1505
98.80
1.20
O1525
98.88
1.12
O1625
99.09
0.91
O1715
98.66
1.34
Average
98.5
1.5
Underflow
U1400-3
19.84
80.16
U1505-3
24.77
75.23
U1525-3
24.59
75.41
U1625-3
19.69
80.31
U1715-3
20.62
79.38
Average
21.9
78.1
From a practical standpoint, it appears that the bench-scale characterization
will give predicted concentrations at least within the same order of magnitude as
the field process. In some cases, it is quite representative of the contaminant
distribution that will be achieved at full scale for this process. From a processing
objective, the statistical analysis suggests that the quality of the underflow was
higher than the quality of the sand produced in the bench-scale testing, which is a
favorable outcome. In some cases this may be attributable to lower concentra-
tions in the process feed, but for other constituents this is not the case. SAS
output is presented in Appendix B.
With regard to the processing objectives, the contaminant concentrations in
the underflow ranged from 2 percent to 39 percent of that in the feed. PCBs were
reduced 95 percent (Arochlor 1242) and 92 percent (Arochlor 1260), from
2,714 g/kg to 144 g/kg, and from 145 g/kg to 11.9 g/kg, respectively.
TOC, oil and grease, and TRPH were significantly reduced in the process
underflow. Most metals concentrations were reduced by an order of magnitude
in the underflow, selenium, silver, and molybdenum being the exceptions.
Selenium was reduced by a factor of 2.6, silver by a factor of 2.6, and
molybdenum by a factor of 7.8.
Data validation sheets are included in Appendix C. Data were evaluated on
the basis of representativeness, comparability, and completeness.
25
Chapter 2 Project Description
|
|
Privacy Statement - Press Release - Copyright Information. - Contact Us - Support Integrated Publishing |