 |
||
|
|
||
|
Page Title:
F.3 Volatile Exposure Evaluation |
||
| |||||||||||||||
|
|
 where
Dm = mass (ng) of compound collected on the trap in time Dt (hr)
Ac = area of the sediment-air interface, cm2
NA(t) is expressed in ng/cm2/hr.
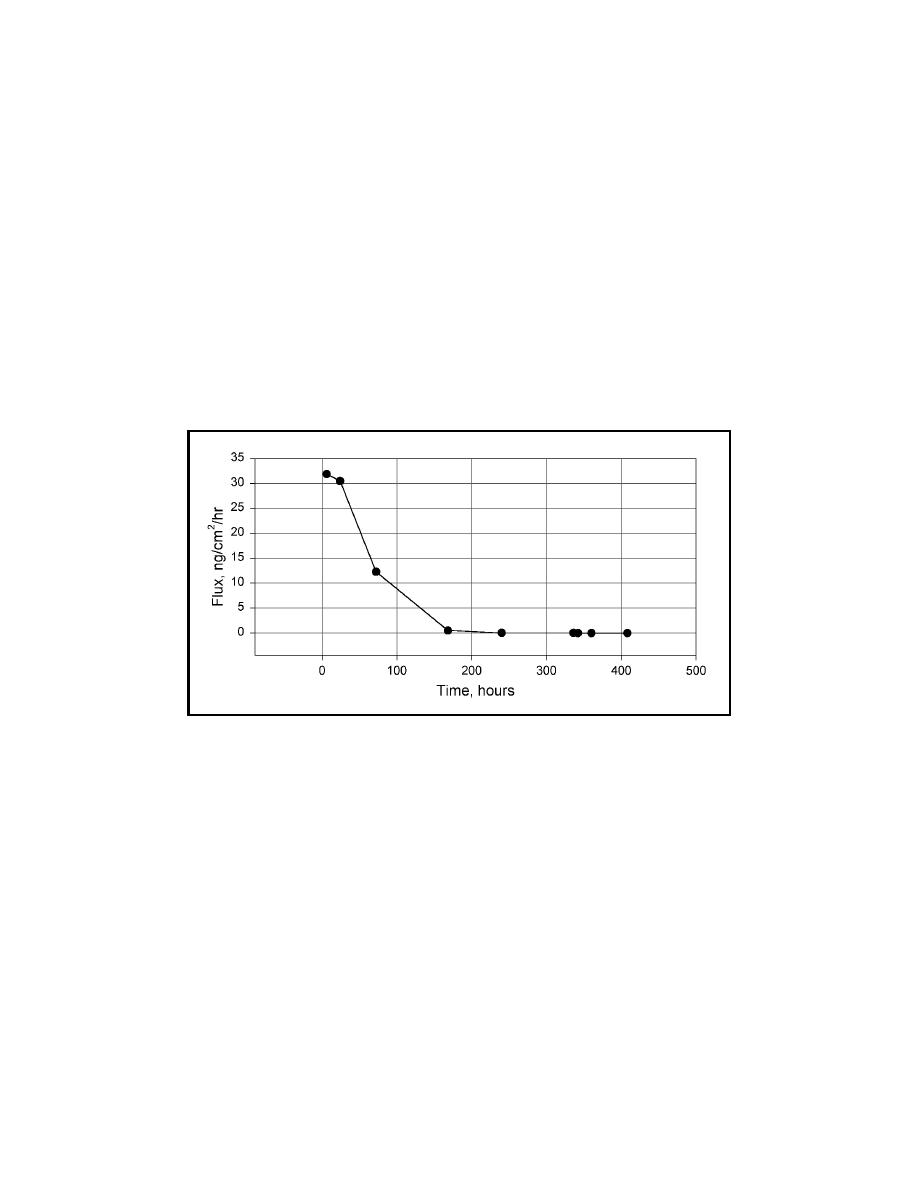
An example of actual fluxes obtained from a contaminated dredged material
is given in Figure F-3. These fluxes represent phenanthrene emissions over a
17-day sampling period. Continuous sampling was conducted, meaning that a
trap was attached to the chamber for the entire sampling period. The first five
points on the graph represent samples of 6, 24, 72, 168, and 240 hr with
corresponding sampling times of 6, 18, 48, 96, and 72 hr. This figure gives a
representative pattern for organic compound (PCBs, PAHs) emissions from a
contaminated dredged material.
Figure F-3. Phenanthrene fluxes from a contaminated dredged material
F.3 Volatile Exposure Evaluation
F.3.1 Site exposure concentration
To estimate the exposure concentration at the site:
a. A control volume of air overlying the site should be designated as a
mixing volume for the contaminant flux. This control volume would
extend over the entire area of volatilization locale to a height
characteristic of worker exposure (typically, about 2 m or 6 ft) and its
volume should be estimated in cubic meters.
b. Next, the air residence time of the control volume for low, medium, and
high wind speeds should be estimated by dividing the length of the site
by the wind speed.
F6
Appendix F Laboratory Evaluation of Volatile Emissions and Volatile Dispersion Modeling
|
|
Privacy Statement - Press Release - Copyright Information. - Contact Us - Support Integrated Publishing |