 |
||
|
|
||
|
Page Title:
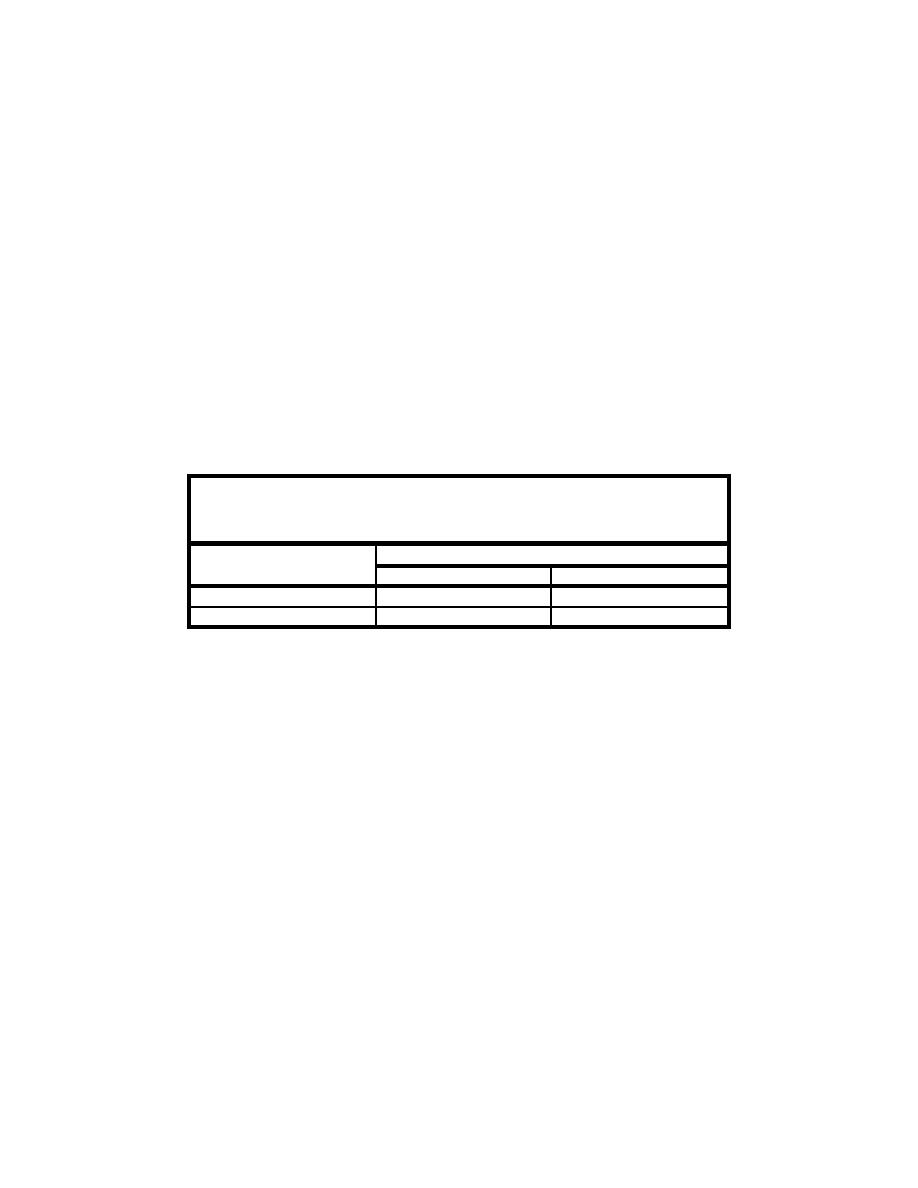
Table L-1: Types of Errors in Hypothesis Testing and Associated Probabilities |
||
| |||||||||||||||
|
|
 mean effect of the treatment is not less than that for the reference. Type II errors
occur when H0 is not rejected when it actually should have been rejected (e.g., in
Case 2, it is concluded that there is no difference in mean effects of the treatment
and reference when, in fact, the true mean effect of the treatment is greater than
that of the reference).
To be environmentally protective in dredged material disposal evaluations, it
is more important to guard against Type II errors. A Type II error could result in
inappropriate placement of dredged sediment, while a Type I error could result
in more costly placement alternatives. The probability of a Type I error is often
represented by the letter a ; the probability of a Type II error is often written as .
The significance level or confidence level of a statistical test is 1 - a . The power
of a test is 1 - , which is the probability of rejecting H0 when it should be
rejected, or in other words, the power to detect true significant differences. For
example, in Case 2 above, the power is the probability of concluding that the
mean effect is greater in the treatment than in the reference when, in fact, this is
true. The types of errors and their associated probabilities are summarized in
Table L-1.
Table L-1
Types of Errors in Hypothesis Testing and Associated
Probabilities
True State of Nature
Hypothesis Test Conclusion
H0 True
H0 False
H0 True(do not reject)
Correct (probability = 1 - a)
Type II Error (probability = )
H0 False(reject)
Type I Error (probability = a)
Correct (probability = 1 - )
In hypothesis testing, the Type I error rate is usually prespecified (biological
tests, by convention, generally set a = 0.05, although there is nothing magical
about this probability). An ideal statistical procedure for hypothesis testing
seeks to maintain the predetermined a , while minimizing the Type II error rate
(i.e., maximizing power). It may not be possible to do both, particularly if the
sample data depart from a normal distribution. A test that does well in
maintaining the predetermined a , regardless of the characteristics of the sample
data, is considered "robust." Tests included in this Appendix were chosen
primarily on the basis of power rather than robustness, as the consequences of
Type II error were considered more severe than those of Type I error.
Simple formulae for calculating the power of certain statistical tests used in
this Appendix are presented along with the descriptions of the tests in Sections
L.2.1.1.1, L.3.1, L.3.2.1, and L.3.2.2. The formulae may be used to calculate the
sample size required to ensure a specific power of detecting an effect of a given
magnitude (effect size), assuming that the effect exists. The formulae can also
be used to calculate the power of a specific sample size to detect a specified
difference. This latter approach is often more relevant than calculating required
sample sizes because budget or logistical constraints usually limit the number of
replicates that can be used in biological tests. This is especially true if the tests
include expensive chemical analyses such as bioaccumulation tests.
L7
Appendix L
Statistical Methods
|
|
Privacy Statement - Press Release - Copyright Information. - Contact Us - Support Integrated Publishing |
