 |
||
|
|
||
|
Page Title:
L.2.1.2 Calculating median lethal concentration |
||
| |||||||||||||||
|
|
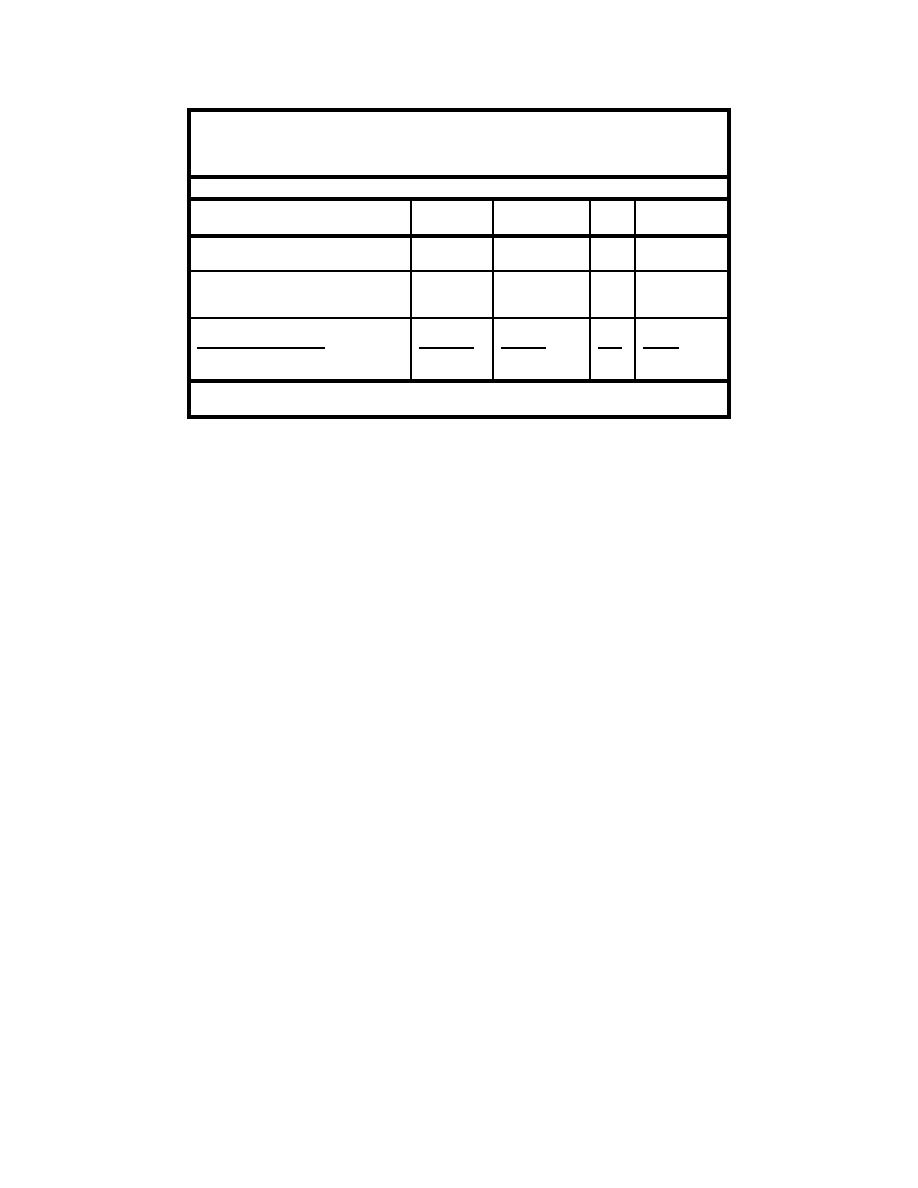 Table L-4
Tests of Assumptions and Hypothesis Tests on Arcsine-
Transformed Water Column Toxicity Test Example Data
Null Hypothesis: Mean 100 percent Elutriate Survival Equals Mean Dilution Water Survival1
Test
Test
Statistic
Probability, P
a
Conclusion
Normality Assumption:
0.051
0.05
Do not reject
W = 0.846
Shapiro-Wilk's Test
Equality of Variances Assumption:
Bartlett's Test
0.47
0.25
Do not reject
F = 0.5
0.468
0.25
Do not reject
F? Test
F? = 2.18
Null Hypothesis:
t-Test (equal variances)
t = 12.734
<0.0001
Reject
0.05
0.05
t-Test (unequal variances)
<0.0001
Reject
t = 12.734
0.05
0.0010
Reject
t-Test on rankits (unequal variances)
t = 4.631
1
Based on tests of assumptions, appropriate statistical test of null hypothesis is underlined. Other
test results are included for illustration only.
When dilution water survival is near 100 percent and variation among
replicates is low, as with the example data, a test with n = 5 replicates may be
too powerful. In many cases, we would declare survival of $90 percent in the
100 percent elutriate significantly lower than in the dilution water, yet that same
$90 percent survival would be acceptable for the dilution water. For this reason,
if survival in the 100 percent elutriate is not at least 10 percent lower than in the
dilution water, the difference should not be considered significant and no
statistical tests need be performed. It is important to remember that a
statistically significant difference is not necessarily biologically significant (and
vice versa). If dilution water survival were lower, say 90 percent instead of
98 percent, and s remained the same, the t-test would have less power. For
example, n = 13 would be required to provide a 0.95 probability of detecting a
reduction in survival in the 100 percent elutriate to 80 percent. Much higher
standard deviations can also be expected in many toxicity tests.
The SAS program WATTOX (Section L.4.1) provides minimum significant
difference and power of a t-test. Power is determined for 10, 20, 30, 40 and
50 percent reductions in true population survival from the mean dilution water
survival.
L.2.1.2 Calculating median lethal concentration
In water column toxicity tests, the median lethal concentration, i.e., concen-
tration lethal to 50 percent of the test organisms (LC50), is calculated when
100 percent elutriate survival is significantly lower than dilution water survival.
Steps and decisions in the LC50 determination are shown in the decision tree in
Figure L-2. Numbers in parentheses in the text refer to numbered nodes of the
decision tree.
Ideally, data for at least five elutriate concentrations should be available to
calculate an LC50, although most methods described below can be used for fewer
concentrations. The control or dilution water survival is not included. Survival
L19
Appendix L
Statistical Methods
|
|
Privacy Statement - Press Release - Copyright Information. - Contact Us - Support Integrated Publishing |
