 |
||
|
|
||
|
Page Title:
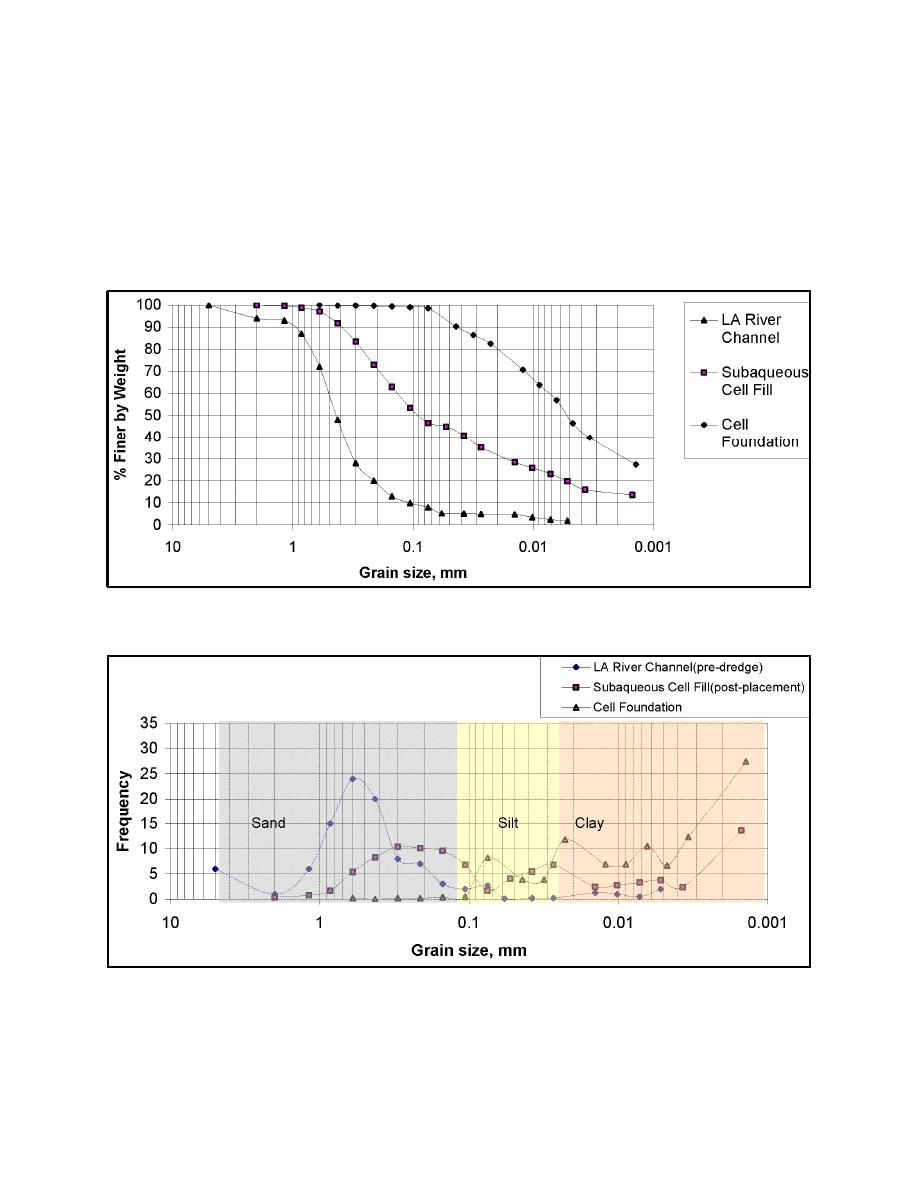
Figure 13. Cumulative grain size distribution (by weight) curves for pre- dredged, post-placed, and original foundation mater... |
||
| |||||||||||||||
|
|
 ERDC TN-DOER-D2
September 2004
At a coarser-grained dredged material site on the Pacific coast, sandy sediment from the Los
Angeles River was grab-sampled prior to clamshell dredging and split-hull dump scow place-
ment onto the bottom of the North Energy Island fine-grained subaqueous pit. A cap (approxi-
mately 3 ft (1 m) thick) of sandy dredged material was placed through approximately 45 ft
(14.8 m) of water onto a very soft silty-clay foundation material, and some mixing of the dredged
fill and foundation materials was expected. Figures 13 and 14 show the grain size distribution
curves for the pre-dredged sediment, post-dredged fill, and original foundation materials, and
Tables 7 and 8 show selected physical properties.
Figure 13. Cumulative grain size distribution (by weight) curves for pre- dredged, post-placed, and origi-
nal foundation materials after mechanical dredging and dump scow placement
Figure 14. Frequency grain size distribution (by weight) curves for pre- dredged, post-placed, and origi-
nal foundation materials after mechanical dredging and dump scow placement
12
|
|
Privacy Statement - Press Release - Copyright Information. - Contact Us - Support Integrated Publishing |
