 |
||
|
|
||
| |||||||||||||||
|
|
 ERDC TN-DOER-N6
March 2000
Sediment Analysis Results. The distribution of the native sediments indicates a trend of
coarser clean quartz sand on the shallower parts of the ebb shoal and finer sediments in the deeper
parts of the ebb shoal. The coarsest material (means of 0.37 to 0.30 mm) is found on the upper
terraces between -6 and -8 m (-20 and -25 ft) mllw. On the terrace between -8 and -9 m (-25 and
-30 ft) mllw, the bulk of the samples have means between 0.3 to 0.28 mm, all in the medium sand
size range. Between -9 and -11 m (-30 and -35 ft) mllw, the bulk of the samples have a mean
between 0.35 and 0.25 mm. Finer material was found in localized holes. Below -11 m (-35 ft)
mllw, on the edges of the trench, medium to fine sands were found, and in the trench basin silt was
found.
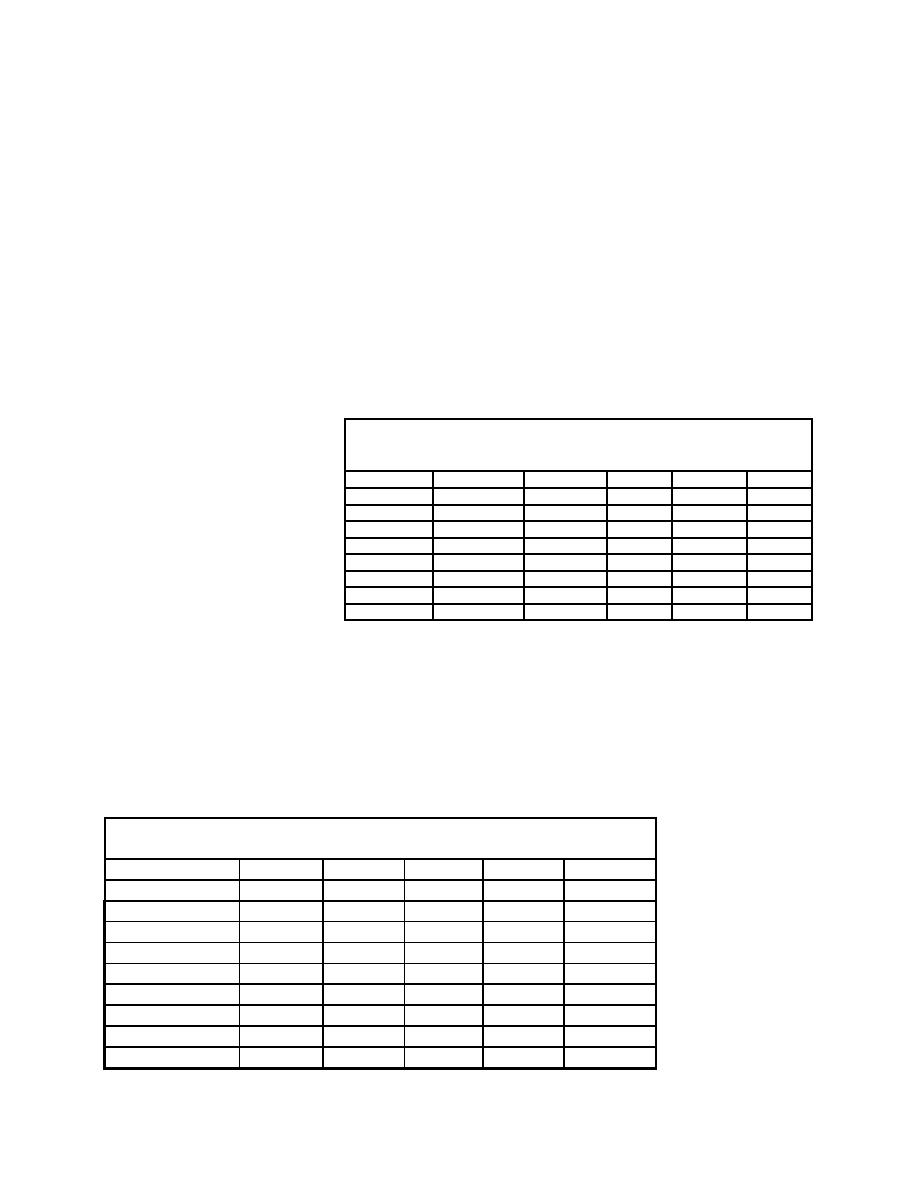
Dredged Material in Placement Site. The three samples collected at the dredging site from
the clamshell were analyzed. These samples had mean grain sizes in the very fine sand to silt range
between 0.099 and 0.048 mm. The five samples of the dredged material taken from the placement
area were also analyzed. Table 3 gives the grain-size means of the samples. The means are similar
to those of the samples col-
lected from the clamshell Table 3
In situ river and postplacement dredged material sediment
dredge. All are in the silt range analysis results, Laser Particle Counter
between 0.058 and 0.040 mm. SAMPLE # EASTING
NORTHING
DATE Mean-mm Mean-phi
These means were for the most Barge 1
1798480.000
264529.00 10/21/98
0.055
4.17
part slightly finer than the na- Barge2
1798376.907
263488.57 11/12/98
0.099
3.33
Barge3
1798546.33
261896.82 11/24/98
0.048
4.39
tive silt material, except for the PD1PROBE 1788147.67
59700.22 12/02/98
0.057
4.13
native silts in the trench. Fig- PD2NE
1788346.74
59799.24 12/02/98
0.047
4.41
ure 6 compares the grain size PD3NW
1788266.43
59854.80 12/02/98
0.051
4.30
frequency curves of the placed PD4SW
1788068.84
59736.38 12/02/98
0.040
4.66
PD5SE
1788136.81
59636.02 12/02/98
0.058
4.12
dredge material to those of the
native sediments.
The five samples of the placed dredged material were further tested for their geotechnical charac-
teristics (Table 4). Testing included initial water content/bulk-density, specific gravity, grain-size
distribution, Atterberg limits and classification, consolidation, and laboratory vane shear
strength. The samples varied little from one to another. The initial bulk densities of the material
ranged from 1,419 to 1,571 kg/cu m (88.6 to 98.1 lb/cu ft). The maximum void ratios determined
at the time of testing were between 5.1 and 6.8, values that are typical for recent ly d e p o s i t e d
sediments and/
Table 4
or mechanically
Geotechnical characteristics of the placed dredged material
dredged material.
Characteristics
Sample 5 Sample 3 Sample 4 Sample 1
Sample 2
All samples were
92.69
98.06
94.45
93.36
88.59
Initial density
classified as gray
5.43
6.28
6.03
6.98
5.19
Maximum void ratio
sandy clay (CH).
CH
CH
CH
CH
CH
Classification
Consolidation tests
71
69
69
65
62
Liquid limit
on the samples
25
26
24
25
24
Plastic limit
showed all of the
46
43
45
40
38
Plasticity Index
samples had similar
2.76
2.65
2.73
2.74
2.65
Specific Gravity
compressibility
15
27
20
27
21
% sand
curves.
85
73
80
73
79
% silt and clay
8
|
|
Privacy Statement - Press Release - Copyright Information. - Contact Us - Support Integrated Publishing |
