 |
||
|
|
||
|
Page Title:
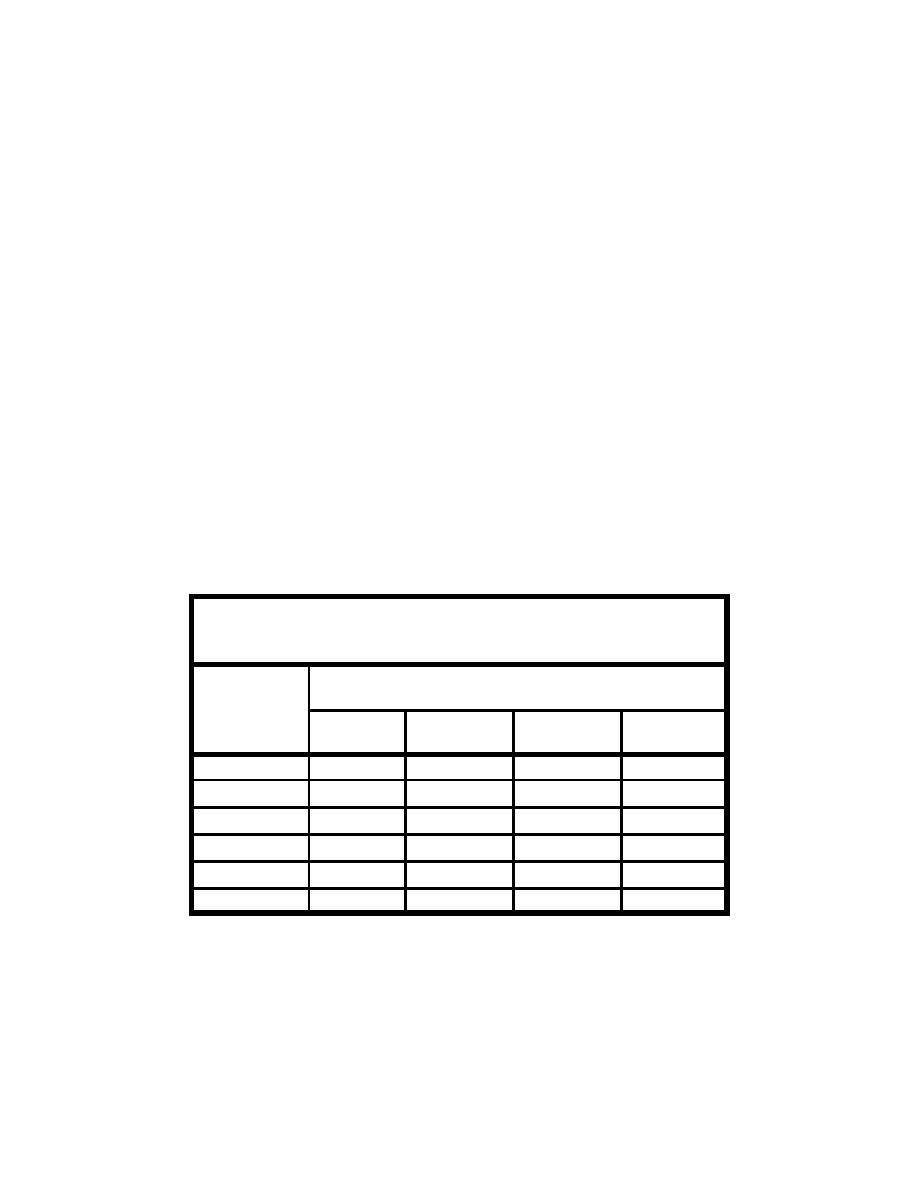
Table G10. Mean Maximum Vertical Erosion Frequency due to Tropical and Extratropical Storms Impacting 0.4-mm Sand-Capped Moun... |
||
| |||||||||||||||
|
|
 events occurring during a single storm season. For example, although an average
of only 2.4 events occur per year at the Mud Dump site, results from the program
EST generates a simulated 200-year sequence of extratropical storm activity
during which it is possible to have eight or nine events in a single season. If
eight or nine severe events were to occur during a single winter season, the sum-
mation of maximum erosion magnitudes for each event may be large enough for
that season to be ranked as a 100-year season.
The erosion versus frequency-of-occurrence relationships for tropical and
extratropical events were combined to generate a single curve and table of fre-
quencies for each of the design configurations. The combined frequency-of-
occurrence is computed by adding the frequencies associated with tropical and
extratropical events for a given magnitude of erosion. For example, consider the
8-ft mound located in 83 ft of water. An erosion of 1.0 ft corresponds to a return
period of 83 years for hurricanes but only 10 years for extratropical events. The
combined frequency is equal to 1/83 + 1/10 or 0.11, corresponding to a return
period of just 9 years. A comparison of the combined event, Table G10, shown
below, and Tables G8 and G9, shows that extratropical events are the dominant
storm type in the New York Bight. This dominance is evidenced by the fact that
the combined event frequency relationships are very similar to the extratropical
relationships. This is not surprising considering that on the average, 15 extra-
tropical storms occur for every hurricane. Also, vertical erosion due to extra-
tropical events is generally more severe than for tropical events due to the longer
duration of extratropical storms.
Table G10
Mean Maximum Vertical Erosion Frequency due to Tropical and
Extratropical Storms Impacting 0.4-mm Sand-Capped Mounds
Mound Con-
figuration Base
Combined Hurricane/Northeaster Single-Year Erosion Frequency, ft
Depth/Mound
Height/Crest
Depth, ft
10 year
25 year
50 year
100 year
63/10/50
2.4
3.0
3.4
3.9
63/08/55
1.6
2.0
2.3
2.6
73/13/60
1.5
1.8
2.0
2.3
73/08/65
1.0
1.3
1.5
1.7
83/13/70
0.9
1.2
1.3
1.6
83/08/75
0.7
0.8
0.9
1.1
A summary of results for the Mud Dump site, shown in Table G10, was
prepared to provide both episodic and cumulative erosion estimates for each
design option. The episodic values are provided at return periods of 10, 25, 50,
and 100 years.
G30
Appendix G Procedures for Conducting Frequency-of-Erosion Studies
|
|
Privacy Statement - Press Release - Copyright Information. - Contact Us - Support Integrated Publishing |
