 |
||
|
|
||
|
Page Title:
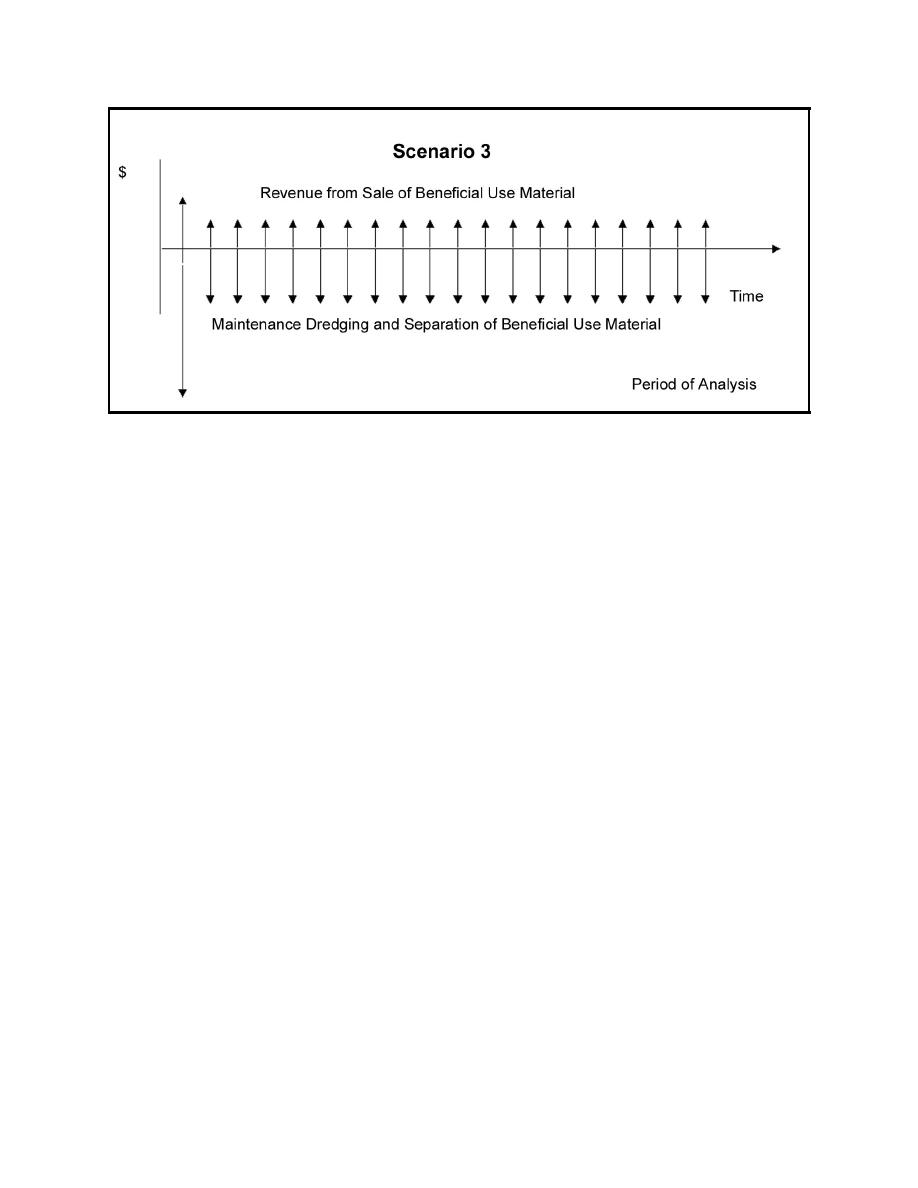
Figure 4. Scenario 3, processing incoming material and material removed from CDF |
||
| |||||||||||||||
|
|
 ERDC TN-DOER-C27
July 2002
Figure 4. Scenario 3, processing incoming material and material removed from CDF
In the first scenario, volume reduction of incoming material (Figure 2), expansion of the CDF is
deferred relative to the baseline condition depicted in Figure 1. This is indicated here by a downward
arrow for raising the berms of the existing CDF. Revenues from the sale of BU material produced
by processing incoming materials are represented by the upward arrow at the time of dredging and
processing. This revenue is assumed to be realized with every dredging and processing event for
purposes of illustration, but is not guaranteed. Regulatory restrictions on use of the material, public
acceptance, and market demand will determine whether the material will be revenue producing.
Comparing the base condition (Figure 1) to scenario 2 (Figure 3), the processing of material removed
from the CDF also postpones the need to expand the capacity of the CDF. In this example, the need
for a new facility is completely eliminated during the period of analysis. Revenues from the sale
of BU material produced by processing previously placed materials are represented in Figure 3 by
the upward arrow at the time of the excavation and processing. The relative rates of material
processing and maintenance dredging will determine how far into the future the need for additional
capacity is postponed.
Figure 4 represents the third scenario, in which incoming material is separated and in-place material
is processed to recover usable material. In this conceptual example, both the expansion of the
existing CDF and the construction of a new CDF are eliminated for the period of analysis. The
downward arrows are longer than in the base condition, reflecting the added cost of processing
incoming material.
Evaluating and Comparing Alternatives
Step 1: Evaluate the alternatives. Calculate the average annual cost of each alternative and
compare to the base condition. The net benefits of the alternative are equal to the average annual
cost of the base condition less the average annual cost of the alternative. The benefit-to-cost ratio
is equal to the average annual cost of the base condition divided by the average annual cost of the
5
|
|
Privacy Statement - Press Release - Copyright Information. - Contact Us - Support Integrated Publishing |