 |
||
|
|
||
|
Page Title:
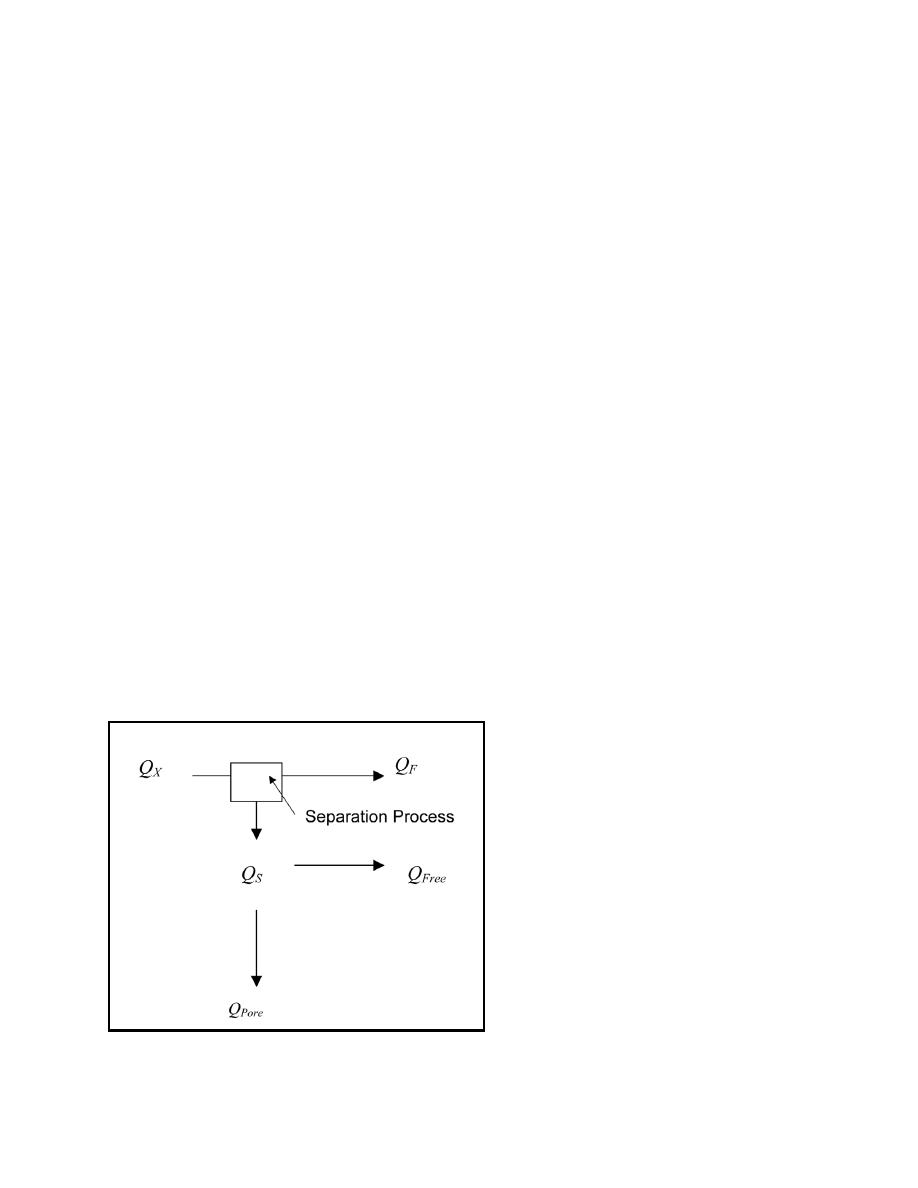
Figure 7. Water balance diagram |
||
| |||||||||||||||
|
|
 ERDC TN-DOER-C27
July 2002
MT = Qsρs
(4)
where
Q = the volumetric flow rate to the separation process, V/T
s = percent solids by volume, as decimal, unitless
ρs = particle density, M/V
MS is the solids mass flow rate of the coarse material from the separation process, and is given by
MS = xmMTc
(5)
where
xm = efficiency of coarse solids separation on a mass basis, unitless (decimal)
c = percent coarse (specified cut size) by mass in bulk material, unitless (decimal)
MF is the solids mass flow rate of the fines from the separation process, and is given by the following,
assuming 100 percent of the fines reports with the process overflow. The first term represents the
coarse material that reports to the fine fraction as a result of process inefficiency:
MF = MTc (1 - xm) + MT (1 - c)
(6)
Volumetric Water Balance QX is the volumetric flow rate of water to the separation process
(Figure 7). QF is the flow rate reporting with the fines, typically the bulk of the processing water.
QS is the flow rate reporting with the coarse fraction. Some of this water will be free draining
(QFree), and will be captured and returned to the process or released as effluent. The residual pore
water makes up the remainder (QPore). QF
and QFree represent volumetric flows that
must be managed. Following a settling or
dewatering process to remove solids, they
may be recirculated through the process, or
treated and released as effluent. Process
slurries are typically fairly dilute, with 10 to
15 percent solids by volume being repre-
sentative. Process water volumes are there-
fore relatively high. Volumes reported in
the literature ranged from approximately
1,000 gallons to 1,700 gallons process water
per cubic yard processed and dewatered
sediment.
The coarse solids fraction is typically tar-
geted for beneficial use and the fine fraction
Figure 7. Water balance diagram
10
|
|
Privacy Statement - Press Release - Copyright Information. - Contact Us - Support Integrated Publishing |
