 |
||
|
|
||
|
Page Title:
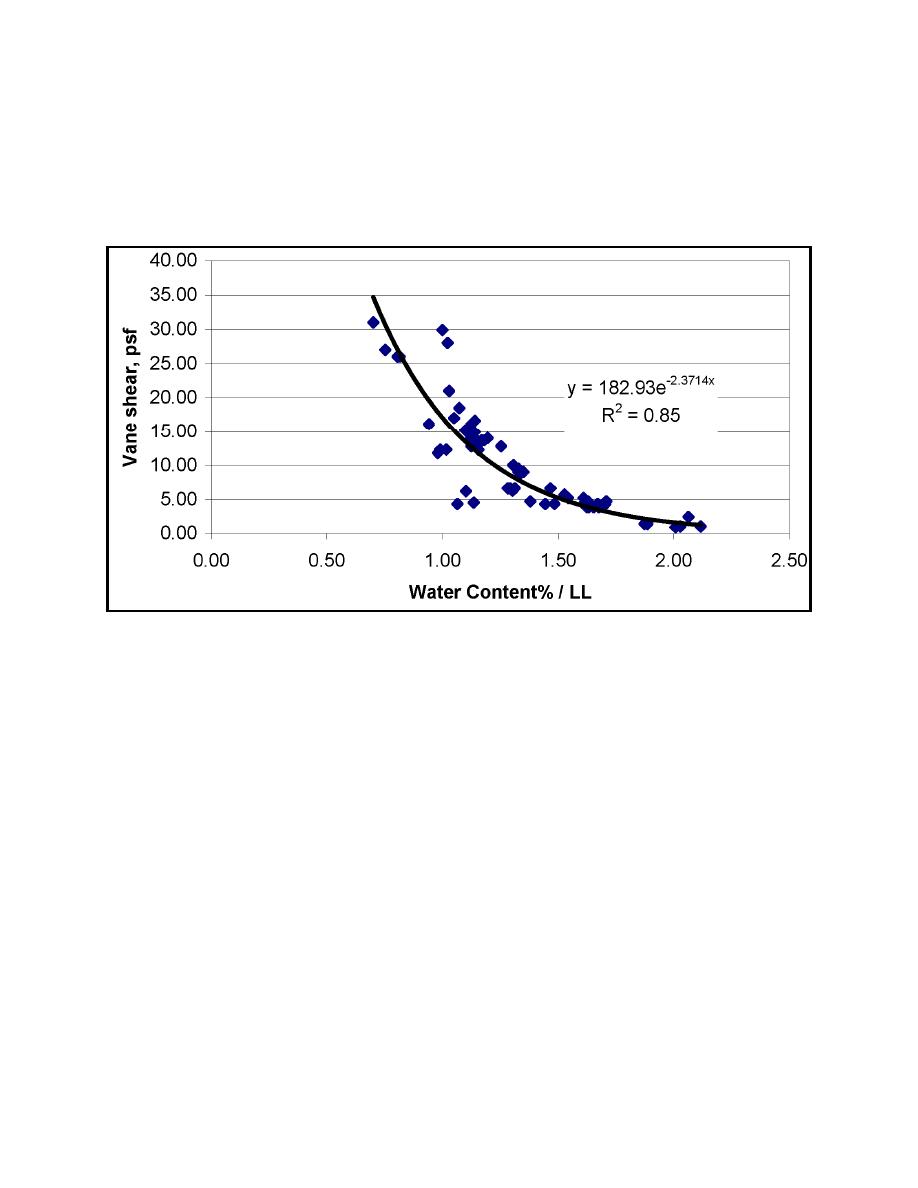
Figure 6. Vane shear strength as a function of water content and liquid limit |
||
| |||||||||||||||
|
|
 ERDC TN-DOER-D1
August 2004
e = 2.718
W/LL = water content percent / liquid limit percent
A relatively low R2 value of 0.85 based on 72 data points likely precludes usage of Equation 12
for anything other than general screening and rapid estimation purposes. Figure 6 shows the
regression curve.
Figure 6. Vane shear strength as a function of water content and liquid limit (to convert pounds per
square foot (psf) to kPa, divide psf by 20.8)
For estimating an unknown effective stressvoid ratio relationship for a cohesive dredged mate-
rial, Figure 7 was generated based on data from 10 self-weight consolidation tests combined with
standard oedometer (fixed ring) consolidation tests. The ratio of water content to water content at
the liquid limit for each material provided the best correlation to effective stress. A relatively low
R2 value of 0.83 based on 166 data points likely precludes usage of this equation for anything
other than general screening and estimating purposes, similar to the vane shear equation above.
σ' = 129.77(W/LL)4.7044
(13)
where
σ' = effective stress, psf
W/LL = water content percent / liquid limit percent
11
|
|
Privacy Statement - Press Release - Copyright Information. - Contact Us - Support Integrated Publishing |