 |
||
|
|
||
|
Page Title:
VARIABILITY DUE TO SPATIAL LOCATION |
||
| |||||||||||||||
|
|
 ERDC TN-DOER-D2
September 2004
reviewing examples from recently published project literature. The data are not intended to be
statistically robust, but are presented to illustrate general trends in property variability.
VARIABILITY DUE TO SPATIAL LOCATION: Physical property changes within a pre-
dredged, undisturbed, and heterogeneous sediment are often uncertain and difficult to predict,
and when the sediment becomes disturbed, remixed, or remolded, the uncertainty becomes
greater. Often the spatial variability influence is detected during sediment sampling conducted
before, during, or after the dredging operation. Horizontal and vertical heterogeneities affect
spatial variability. The following two examples are from the same project in Boston Harbor and
serve to illustrate the changes in physical properties and engineering behavior encountered sim-
ply because of the samples' horizontal locations.
River Sediment Samples. Surficial grab samples were taken from the bottom of the Mystic
River in Boston, Massachusetts, for the purpose of characterizing the geotechnical properties of
material to be subsequently dredged and placed in subaqueous disposal cells located further
downstream in the Mystic River and Boston Harbor. The samples were taken with small
(150 cu in. or 0.0033 cu m) hand-operated bottom dredge samplers, which scooped surficial
material from the channel bottom at a depth of approximately 40 ft (13.2 m). Several samples
from within a 50-ft (16.5 m) radius of each of three target locations (MRA, MRB, and MRC)
were withdrawn to the surface and placed in a sealed bucket. Each target location was approxi-
mately 1000 ft (330 m) apart. Myre et al. (2000) and Science Applications International Corpo-
ration (SAIC) (2000) describe the geotechnical aspects of the Boston Harbor project including
the sampling methods and locations.
The upstream sample (MRA), the middle sample (MRB), and the downstream sample (MRC),
were analyzed for specific gravity, grain size distribution, Atterberg limits (plastic and liquid
limits), organic content, water content, vane shear strength, and consistency. Visual identification
indicated a fine-grained, dark gray, highly plastic material that appeared to be the same in all
three samples. Laboratory testing indicated that the three samples had distinctly different engi-
neering properties, as indicated in Table 1.
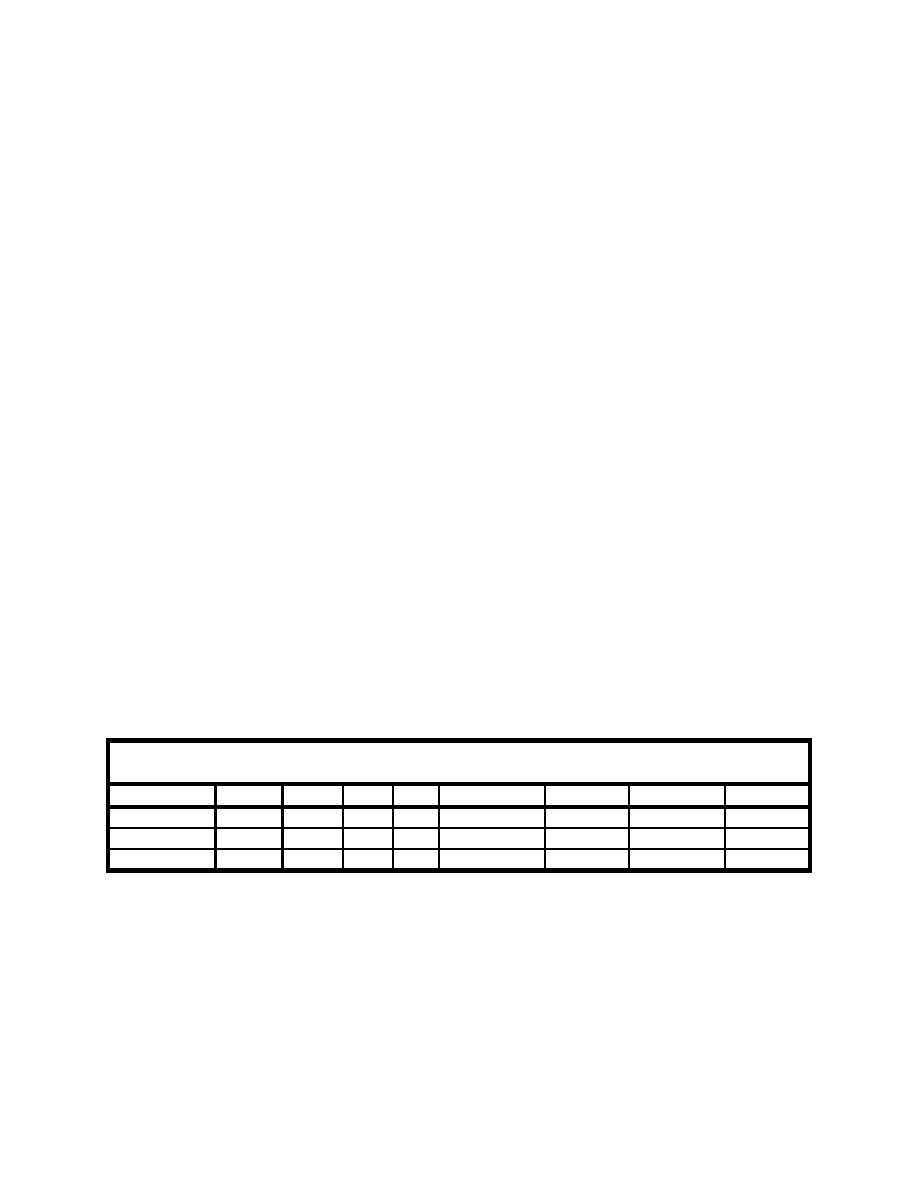
Table 1
Physical Properties of Visually Identical River Bottom Samples
Sample
Gs
LL
PL
PI
% sand
% silt
% clay
Class
MRA
2.76
110
37
73
1
74
25
CH
MRB
2.74
92
37
55
8
48
44
CH
MRC
2.74
77
31
46
16
40
44
CH
All three samples are classified as high plasticity clay with similar specific gravity (Gs) and
similar plastic limit (PL). The grain size distribution varies significantly for MRA, which also
has the highest liquid limit (LL). Figure 1 shows the cumulative grain size distribution curves for
all three samples, Figure 2 shows the frequency grain size distribution curves, and Table 2 shows
the median and mean grain sizes.
2
|
|
Privacy Statement - Press Release - Copyright Information. - Contact Us - Support Integrated Publishing |
