 |
||
|
|
||
|
Page Title:
Figure 1. Cumulative grain size distribution (by weight) curves for river bottom samples |
||
| |||||||||||||||
|
|
 ERDC TN-DOER-D2
September 2004
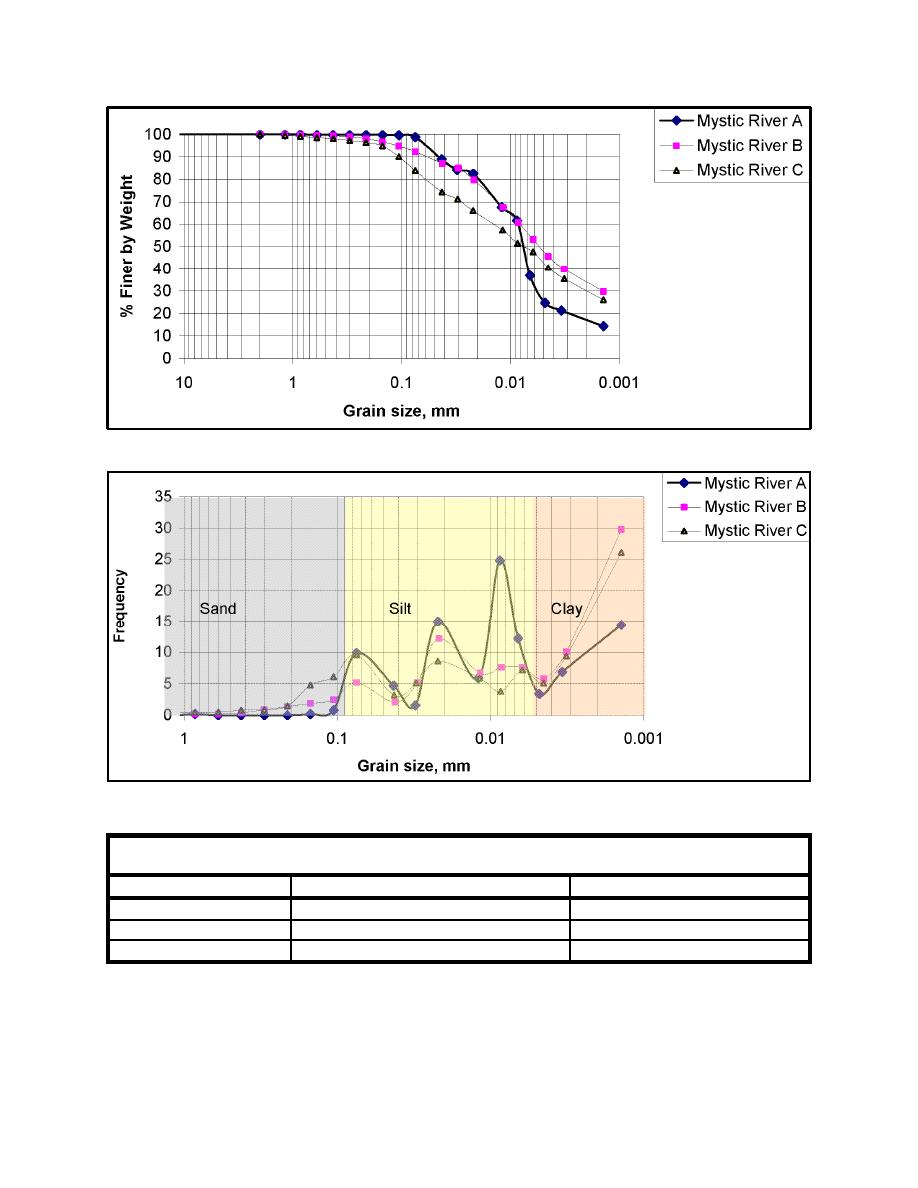
Figure 1. Cumulative grain size distribution (by weight) curves for river bottom samples
Figure 2. Frequency grain size distribution (by weight) curves for river bottom samples
Table 2
Median and Mean Grain Size (by weight) for River Bottom Samples
Sample
Median, mm
Mean, mm
MRA
0.008
0.02
MRB
0.005
0.03
MRC
0.008
0.06
These curves show that the grain size distributions for samples MRB and MRC are similar, but
MRA has a significantly different grain size distribution. MRA has a smaller clay size fraction
(25 percent) and a higher silt size fraction (74 percent) than the other two samples. Based on the
3
|
|
Privacy Statement - Press Release - Copyright Information. - Contact Us - Support Integrated Publishing |
