 |
||
|
|
||
|
Page Title:
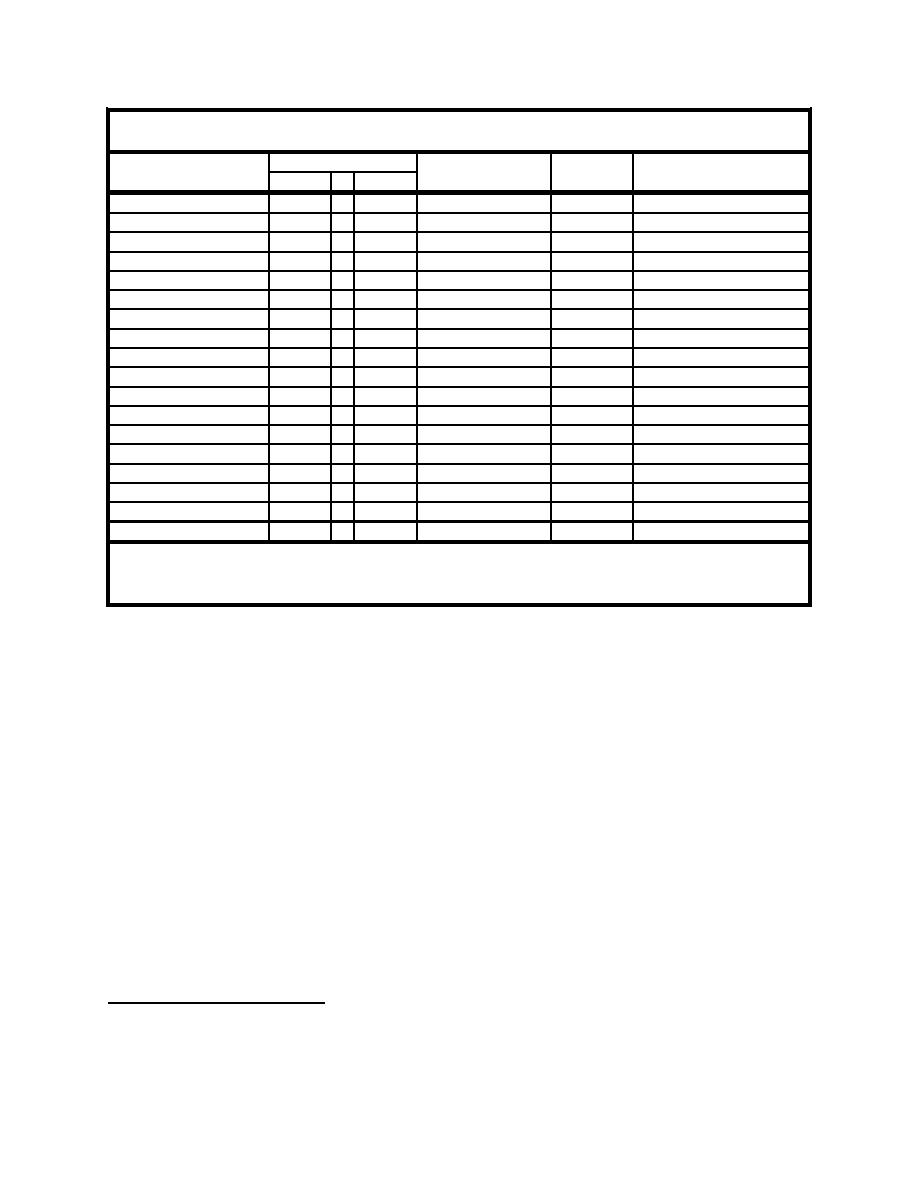
Table 4. TBP and RSS Calculation Data and Comparison of TBP with Measured Tissue Concentration |
||
| |||||||||||||||
|
|
 ERDC TN-DOER-R5
September 2004
Table 4
TBP and RSS Calculation Data and Comparison of TBP with Measured Tissue Concentration
1
Cs
2
-1
3
4
PCDD/F
TBP pg g w.w.
Ct mean
Relative % difference
mean
n
SE
2,3,7,8-TCDD
0.474
4
0.091
1.350
1.774
-23.9
1,2,3,6,7,8-HxCDD
0.598
4
0.092
0.828
1.051
-21.2
1,2,3,7,8,9-HxCDD
0.608
4
0.133
2.057
1.047
96.4
1,2,3,4,6,7,8-HpCDD
4.390
4
1.750
1.438
3.323
-56.7
OCDD
46.086
4
18.359
11.964
25.639
-53.3
2,3,7,8-TCDF
0.718
4
0.250
4.241
3.163
34.1
1,2,3,4,7,8-HxCDF
0.458
4
0.165
0.866
0.796
8.7
1,2,3,6,7,8-HxCDF
0.203
4
0.033
1.471
0.666
121.0
1,2,3,7,8,9-HxCDF
0.328
4
0.047
1.341
0.786
70.5
1,2,3,4,6,7,8-HpCDF
1.659
4
0.554
0.344
4.858
-92.9
OCDF
3.039
4
1.086
0.656
1.741
-62.3
Total TCDD
0.521
4
0.077
0.873
3.477
-74.9
Total HxCDD
2.580
4
1.074
0.636
3.617
-82.4
Total HpCDD
6.709
4
2.949
0.836
12.004
-93.0
Total TCDF
2.609
4
1.229
3.202
15.924
-79.9
Total PeCDF
1.401
4
0.783
1.394
4.789
-70.9
Total HxCDF
1.934
4
0.693
1.005
2.598
-61.3
Total HpCDF
2.341
4
0.706
0.450
4.137
-89.1
1
-1
Cs: Concentration in sediment, pg g d.w.
2
fOC: mean = 0.0050365 d.w., n = 4, SE = 0.00161952; fL: mean = 0.0331176 w.w, n = 17, SE = 0.0036175
3
-1
Ct: Concentration in pooled tissues, pg g , w.w.
4
(TBP mean Ct)*100/mean Ct.
In order to put bounds on the point estimate (TBP = 1.35 pg g-1) using the RSS method, first the
method error and propagated error are estimated, and then they are combined. Method error
(ME) is the error inherent in the model equation itself, and would remain even if all of the input
parameters could be measured with perfect accuracy. The average ME is found using a data set
containing both the input parameters for calculating TBP (mean Cs, mean fOC, and mean fL)
and the associated measured tissue concentration of sediment-exposed biota (mean Ct), assuming
no error in the input values. The average ME is calculated by:
avg ME = 3 *[ 100 (TBP * 100)/Ct ]*/n
(7)
The average TBP ME using the ERDC-BSAF Database-derived PCDD/F BSAFs in Table 3 and
the New York Bight pooled sediment and pooled organism data in Table 4 was found to be
62.7 percent.1
Using this value, the ME for each PCDD/F congener TBP estimation was calculated as:
MEi = TBPi * avg ME/100
(8)
1
The average percent method error was calculated excluding the data for 1,2,3,7,8,9-HxCDD and 1,2,3,4,6,7,8-
HpCDF because all replicate tissue concentrations were reported as < DL for these congeners. This was an
operational decision based on the consideration that in the absence of any quantifiable concentrations within a given
set of replicates, no acceptable estimates could be made.
7
|
|
Privacy Statement - Press Release - Copyright Information. - Contact Us - Support Integrated Publishing |